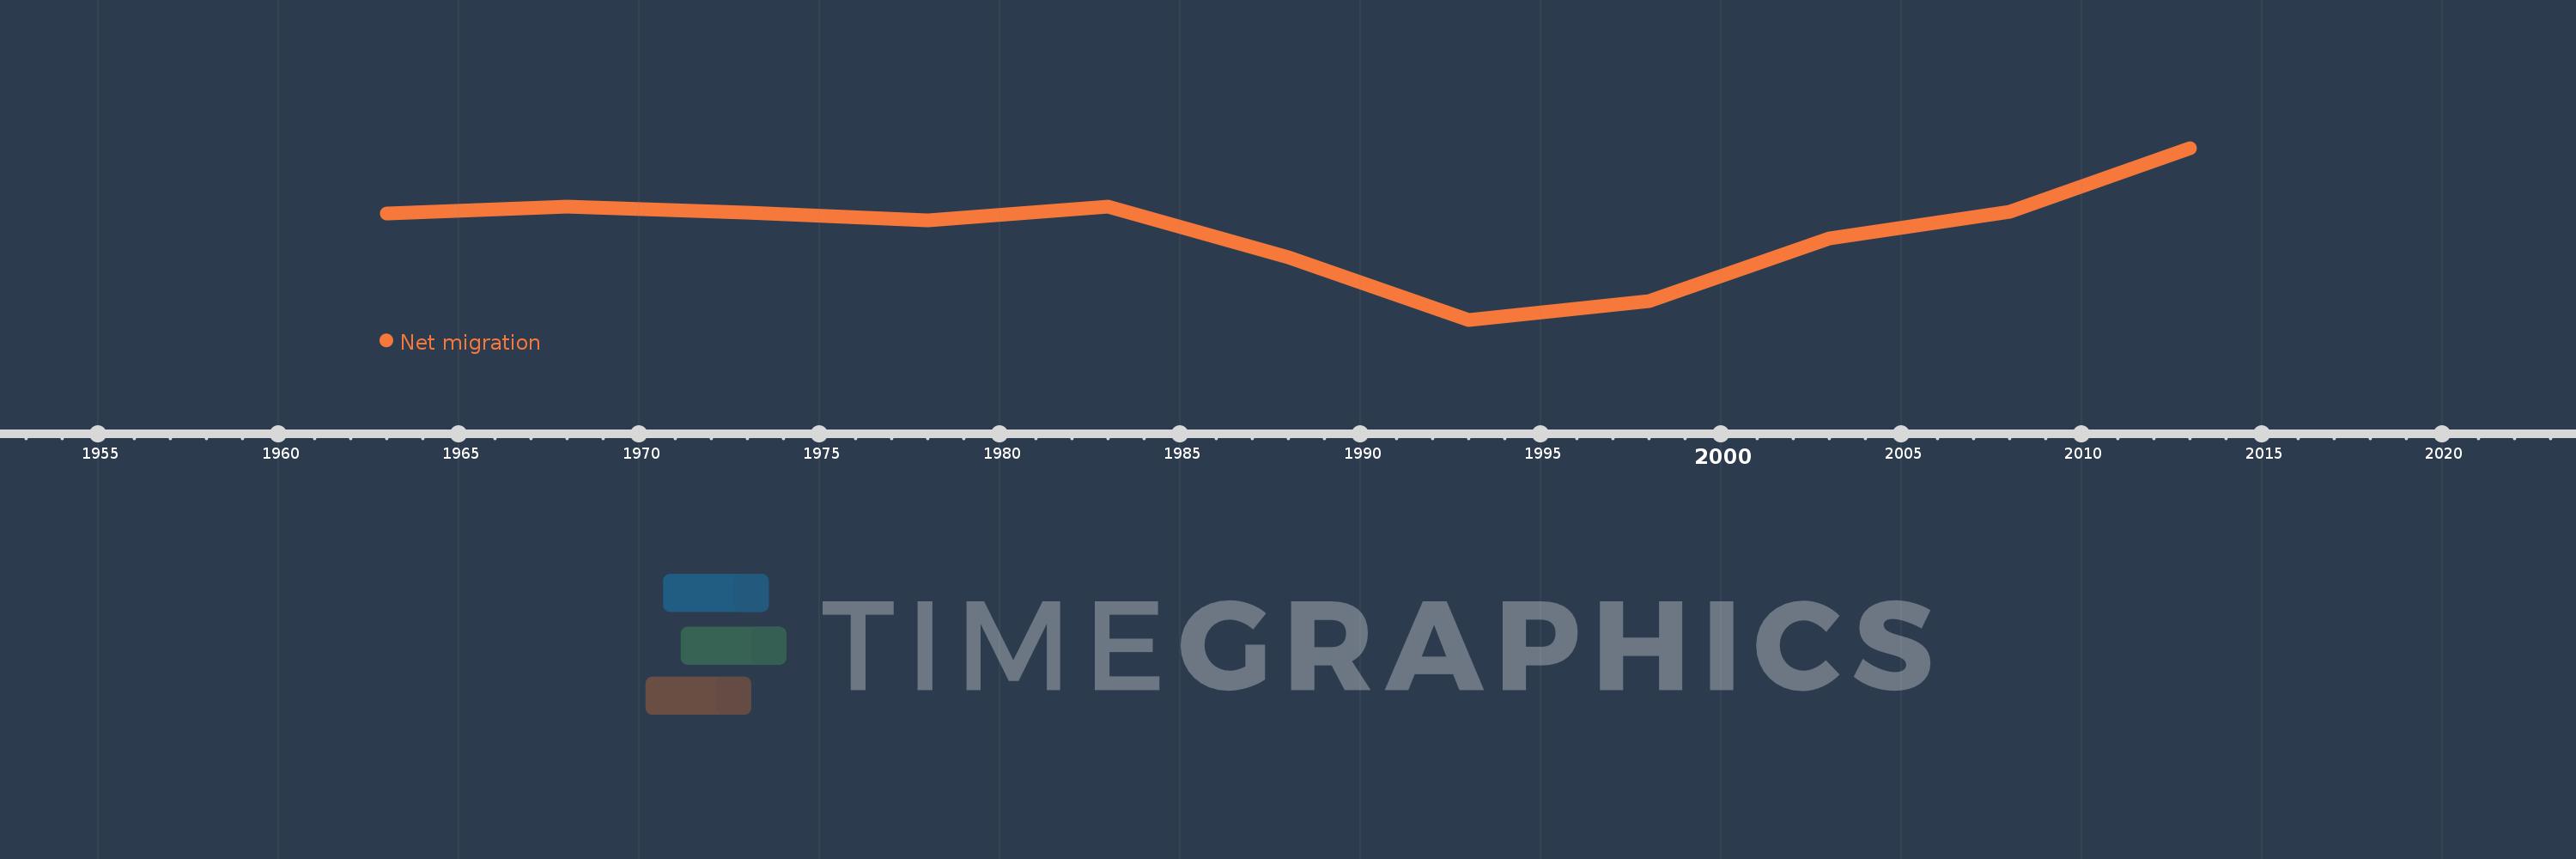
This timeline shows a graph from 1963 to 2013 of Europe & Central Asia (excluding high income). No data until 1962. Number of actual observations by date: 11.
Source name:
World Development Indicators
Source organization:
United Nations Population Division, World Population Prospects.
Categories, topics:
Financial Sector, Health, Aid Effectiveness
Last updated:
apr 23, 2017
Indicators value changes by year
Meaning:
-540.665K
Minimum:
-3.419 mln
jan 1, 1993
Maximum:
2.121 mln
jan 1, 2013
At the date of observation
Value
Absolute change
Change from the previous value
jan 1, 1963
10.238K
+10.238K
0.0%
jan 1, 1968
224.818K
+214.58K
2.1K%
jan 1, 1973
31.783K
-193.035K
-85.86%
jan 1, 1978
-202.389K
-234.172K
-736.78%
jan 1, 1983
237.484K
+439.873K
-217.34%
jan 1, 1988
-1.407 mln
-1.644 mln
-692.36%
jan 1, 1993
-3.419 mln
-2.012 mln
143.06%
jan 1, 1998
-2.809 mln
+609.789K
-17.83%
jan 1, 2003
-793.952K
+2.015 mln
-71.74%
jan 1, 2008
58.963K
+852.915K
-107.43%
jan 1, 2013
2.121 mln
+2.062 mln
3.5K%
Ranking of countries by current statistics by years