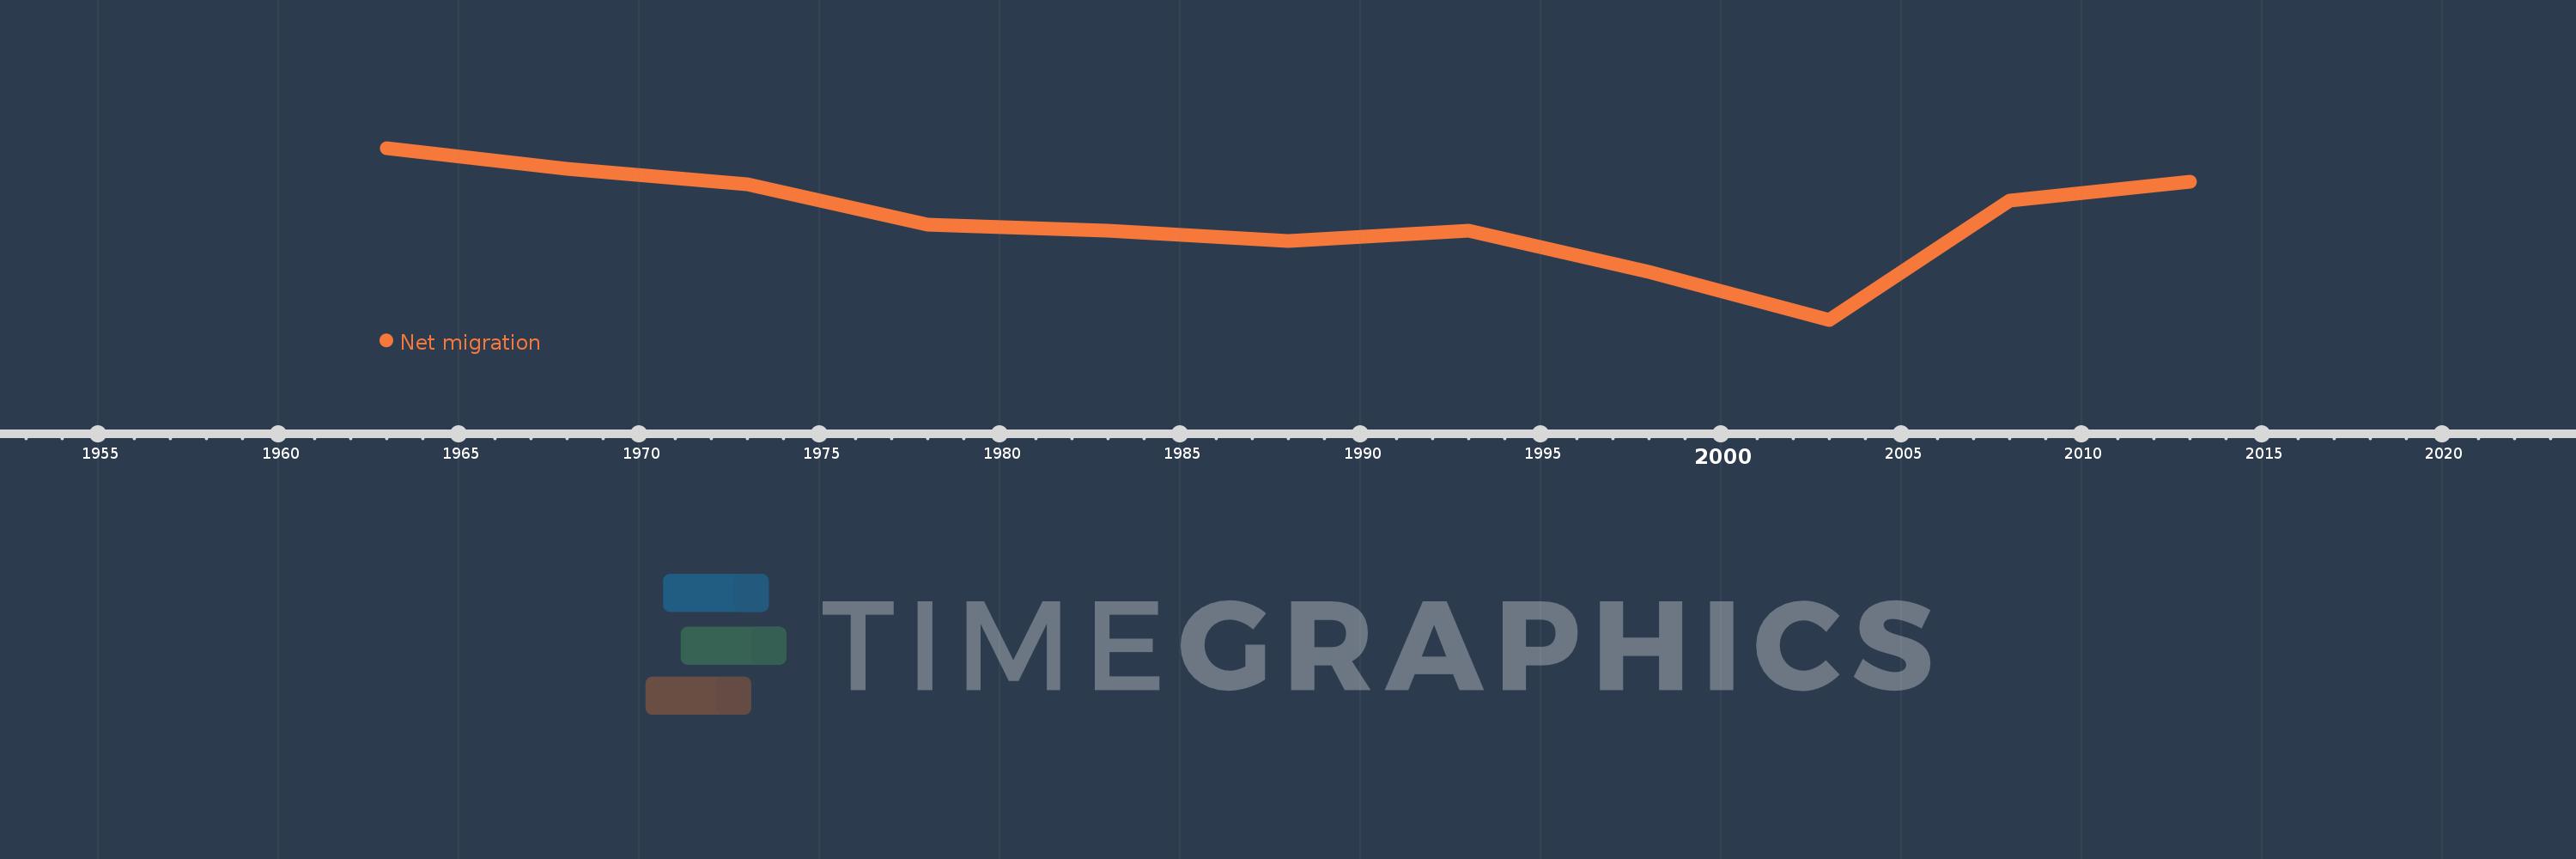
This timeline shows a graph from 1963 to 2013 of Latin America & the Caribbean (IDA & IBRD countries). No data until 1962. Number of actual observations by date: 11.
Source name:
World Development Indicators
Source organization:
United Nations Population Division, World Population Prospects.
Categories, topics:
Financial Sector, Health, Aid Effectiveness
Last updated:
apr 23, 2017
Indicators value changes by year
Meaning:
-2.807 mln
Minimum:
-5.261 mln
jan 1, 2003
Maximum:
-1.1 mln
jan 1, 1963
At the date of observation
Value
Absolute change
Change from the previous value
jan 1, 1963
-1.1 mln
-1.1 mln
0.0%
jan 1, 1968
-1.614 mln
-513.854K
46.7%
jan 1, 1973
-1.985 mln
-371.254K
23.0%
jan 1, 1978
-2.949 mln
-963.67K
48.54%
jan 1, 1983
-3.106 mln
-156.355K
5.3%
jan 1, 1988
-3.348 mln
-242.724K
7.82%
jan 1, 1993
-3.114 mln
+234.191K
-6.99%
jan 1, 1998
-4.113 mln
-998.817K
32.07%
jan 1, 2003
-5.261 mln
-1.149 mln
27.93%
jan 1, 2008
-2.369 mln
+2.893 mln
-54.98%
jan 1, 2013
-1.914 mln
+455.205K
-19.22%
Ranking of countries by current statistics by years