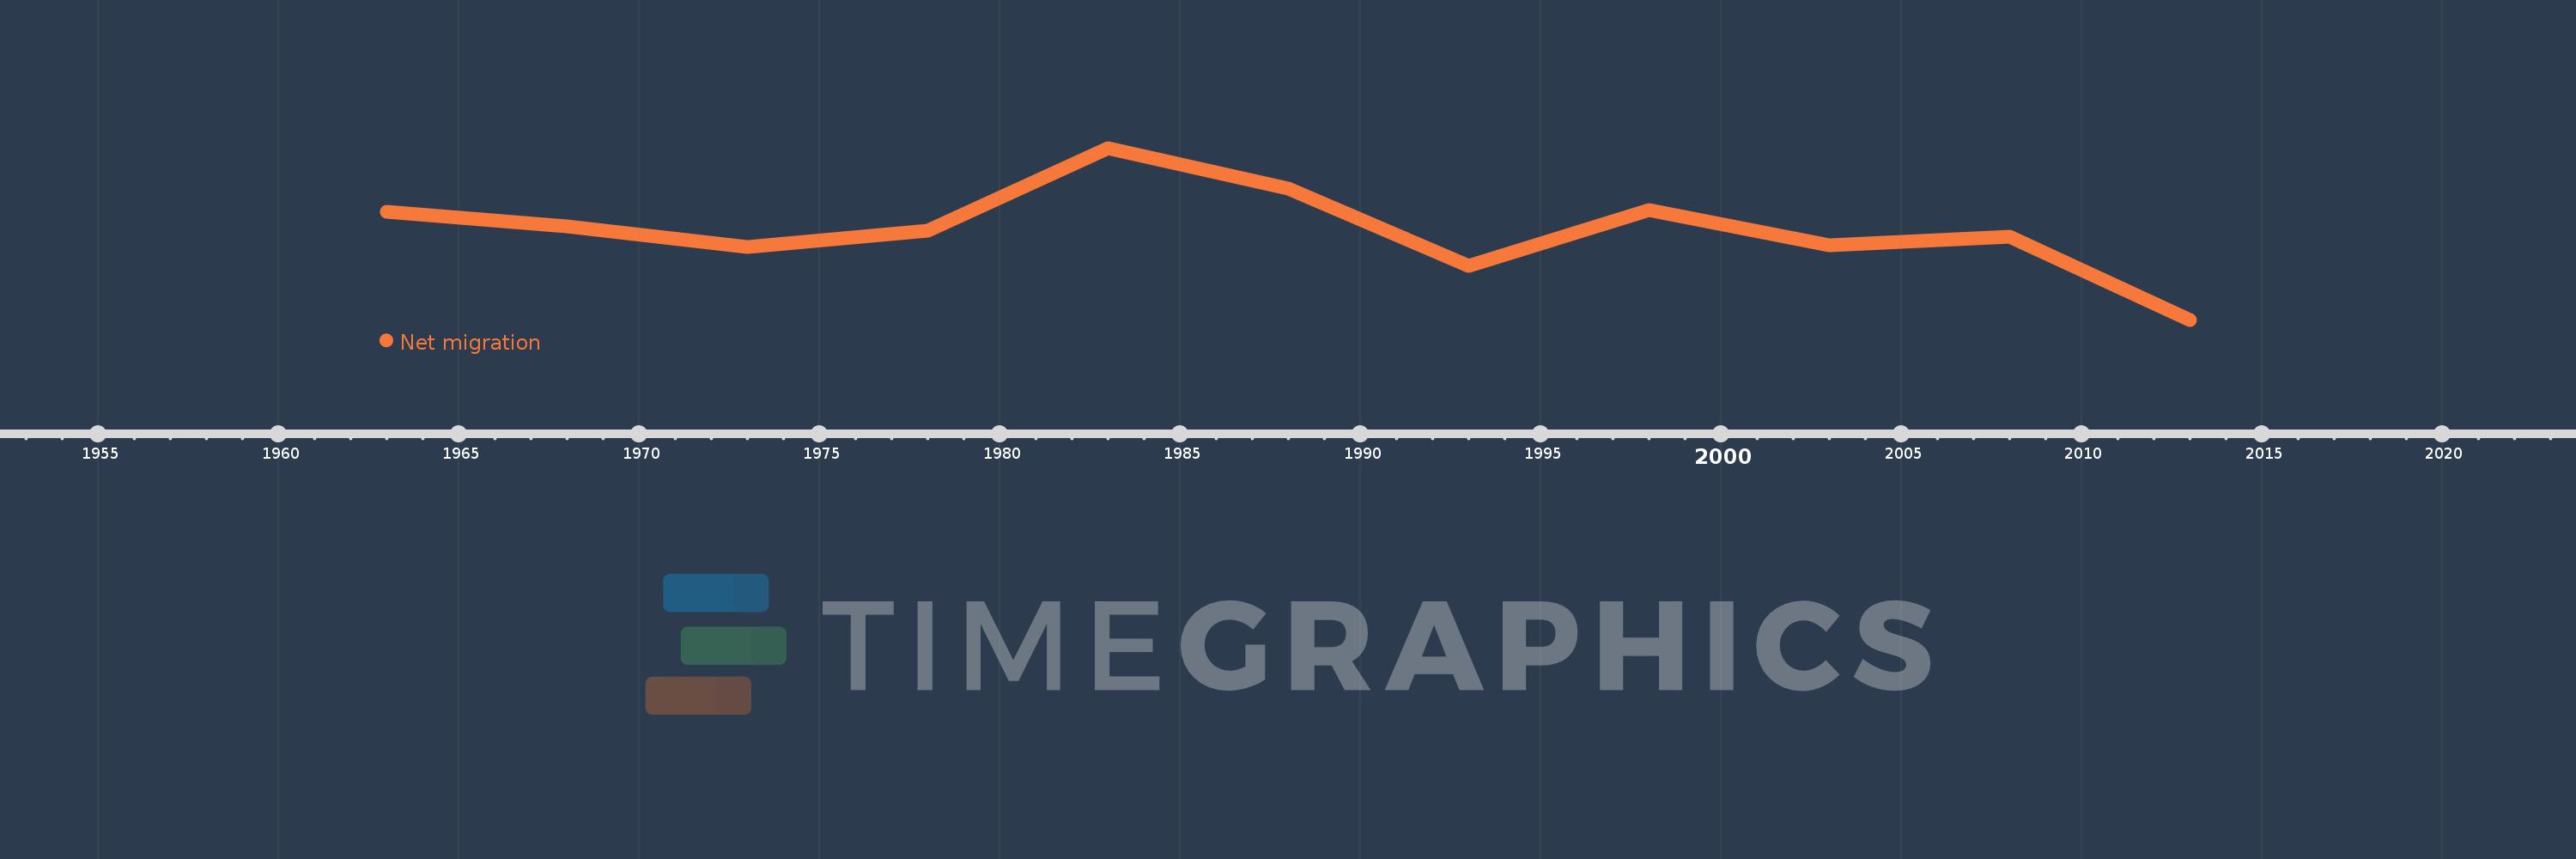
This timeline shows a graph from 1963 to 2013 of Middle East & North Africa (excluding high income). No data until 1962. Number of actual observations by date: 11.
Source name:
World Development Indicators
Source organization:
United Nations Population Division, World Population Prospects.
Categories, topics:
Financial Sector, Health, Aid Effectiveness
Last updated:
apr 23, 2017
Indicators value changes by year
Meaning:
-1.28 mln
Minimum:
-3.616 mln
jan 1, 2013
Maximum:
855.807K
jan 1, 1983
At the date of observation
Value
Absolute change
Change from the previous value
jan 1, 1963
-801.516K
-801.516K
0.0%
jan 1, 1968
-1.178 mln
-376.861K
47.02%
jan 1, 1973
-1.733 mln
-554.732K
47.08%
jan 1, 1978
-1.304 mln
+429.113K
-24.76%
jan 1, 1983
855.807K
+2.16 mln
-165.63%
jan 1, 1988
-204.318K
-1.06 mln
-123.87%
jan 1, 1993
-2.219 mln
-2.015 mln
986.18%
jan 1, 1998
-752.761K
+1.467 mln
-66.08%
jan 1, 2003
-1.687 mln
-934.195K
124.1%
jan 1, 2008
-1.443 mln
+244.332K
-14.48%
jan 1, 2013
-3.616 mln
-2.173 mln
150.63%
Ranking of countries by current statistics by years