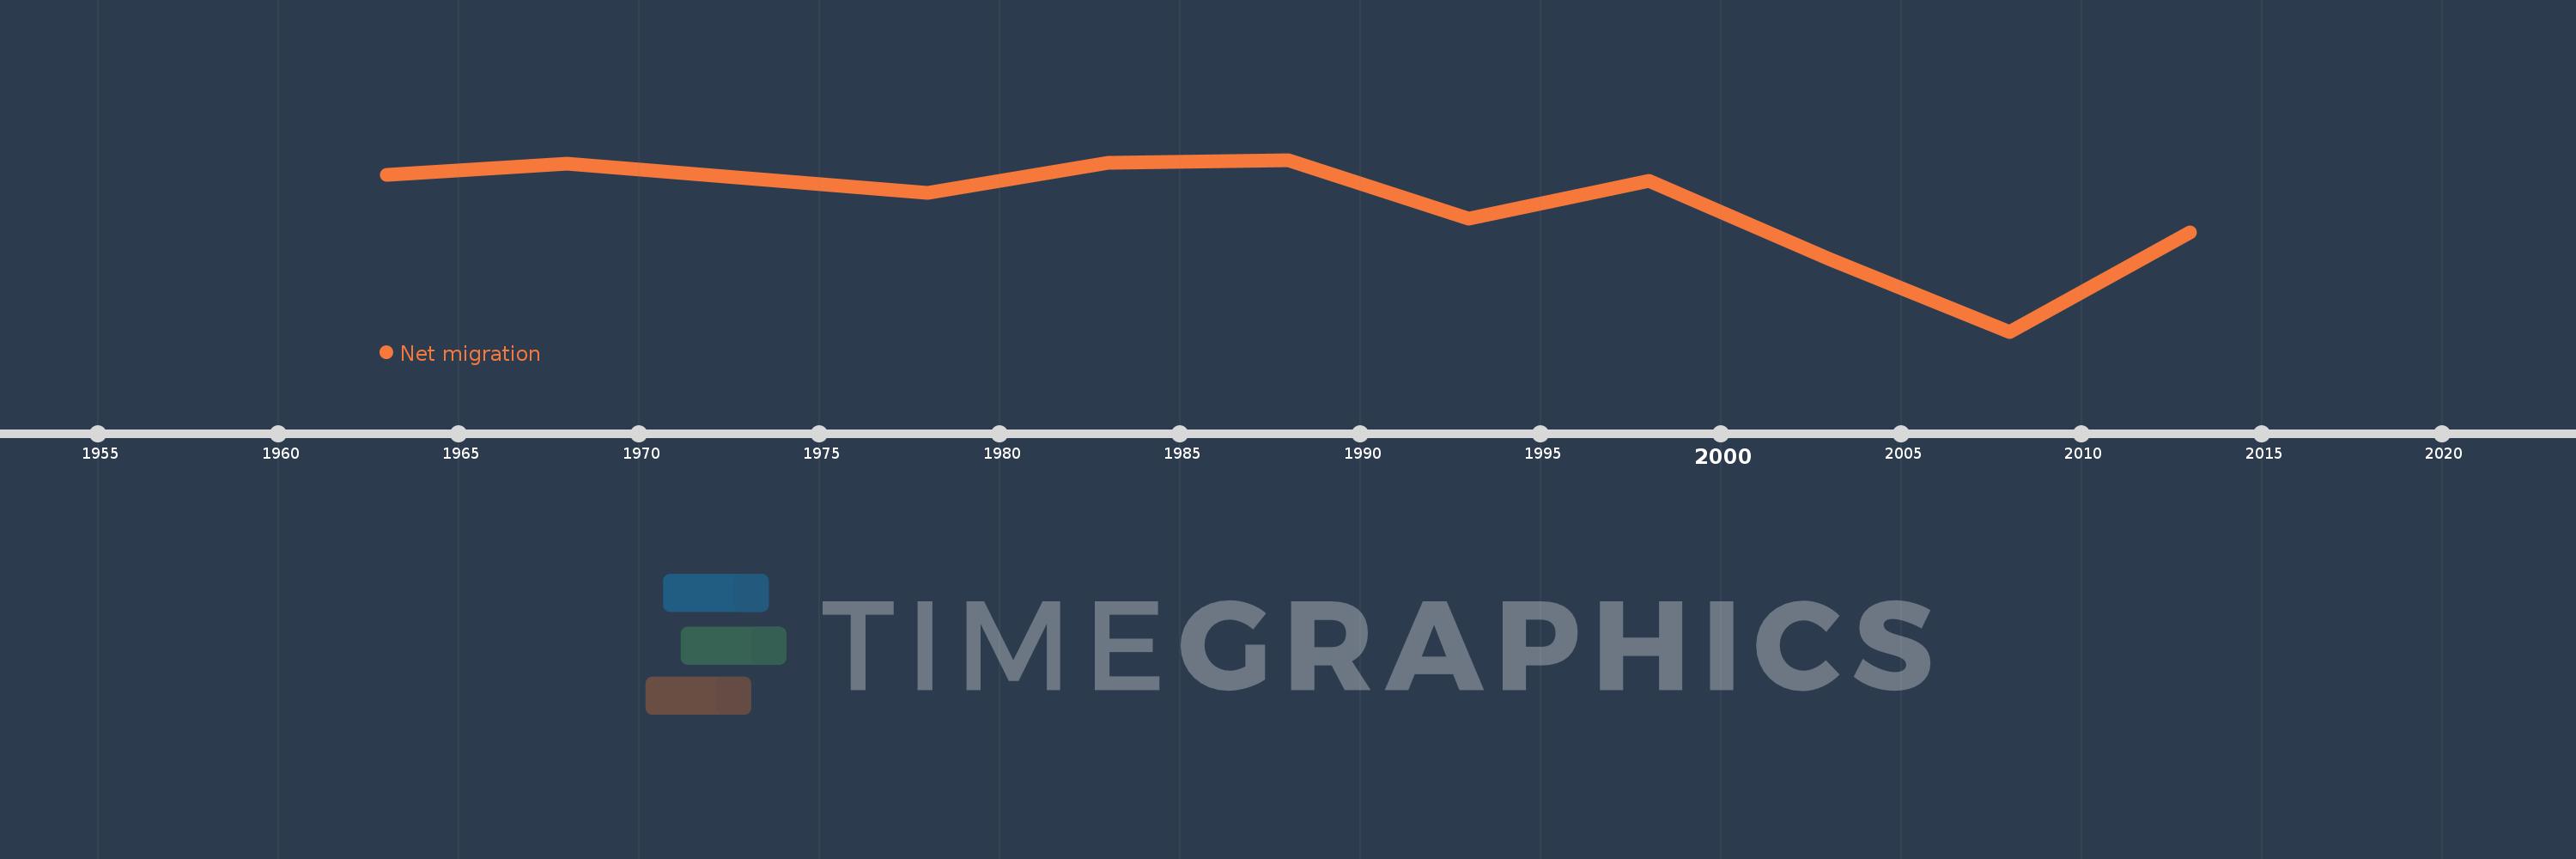
This timeline shows a graph from 1963 to 2013 of East Asia & Pacific (IDA & IBRD countries). No data until 1962. Number of actual observations by date: 11.
Source name:
World Development Indicators
Source organization:
United Nations Population Division, World Population Prospects.
Categories, topics:
Financial Sector, Health, Aid Effectiveness
Last updated:
apr 23, 2017
Indicators value changes by year
Meaning:
-2.475 mln
Minimum:
-8.308 mln
jan 1, 2008
Maximum:
-390.019K
jan 1, 1988
At the date of observation
Value
Absolute change
Change from the previous value
jan 1, 1963
-1.087 mln
-1.087 mln
0.0%
jan 1, 1968
-582.028K
+504.516K
-46.43%
jan 1, 1973
-1.239 mln
-657.126K
112.9%
jan 1, 1978
-1.912 mln
-673.029K
54.31%
jan 1, 1983
-525.665K
+1.387 mln
-72.51%
jan 1, 1988
-390.019K
+135.646K
-25.8%
jan 1, 1993
-3.11 mln
-2.72 mln
697.5%
jan 1, 1998
-1.362 mln
+1.748 mln
-56.21%
jan 1, 2003
-4.975 mln
-3.613 mln
265.24%
jan 1, 2008
-8.308 mln
-3.333 mln
66.99%
jan 1, 2013
-3.728 mln
+4.58 mln
-55.13%
Ranking of countries by current statistics by years