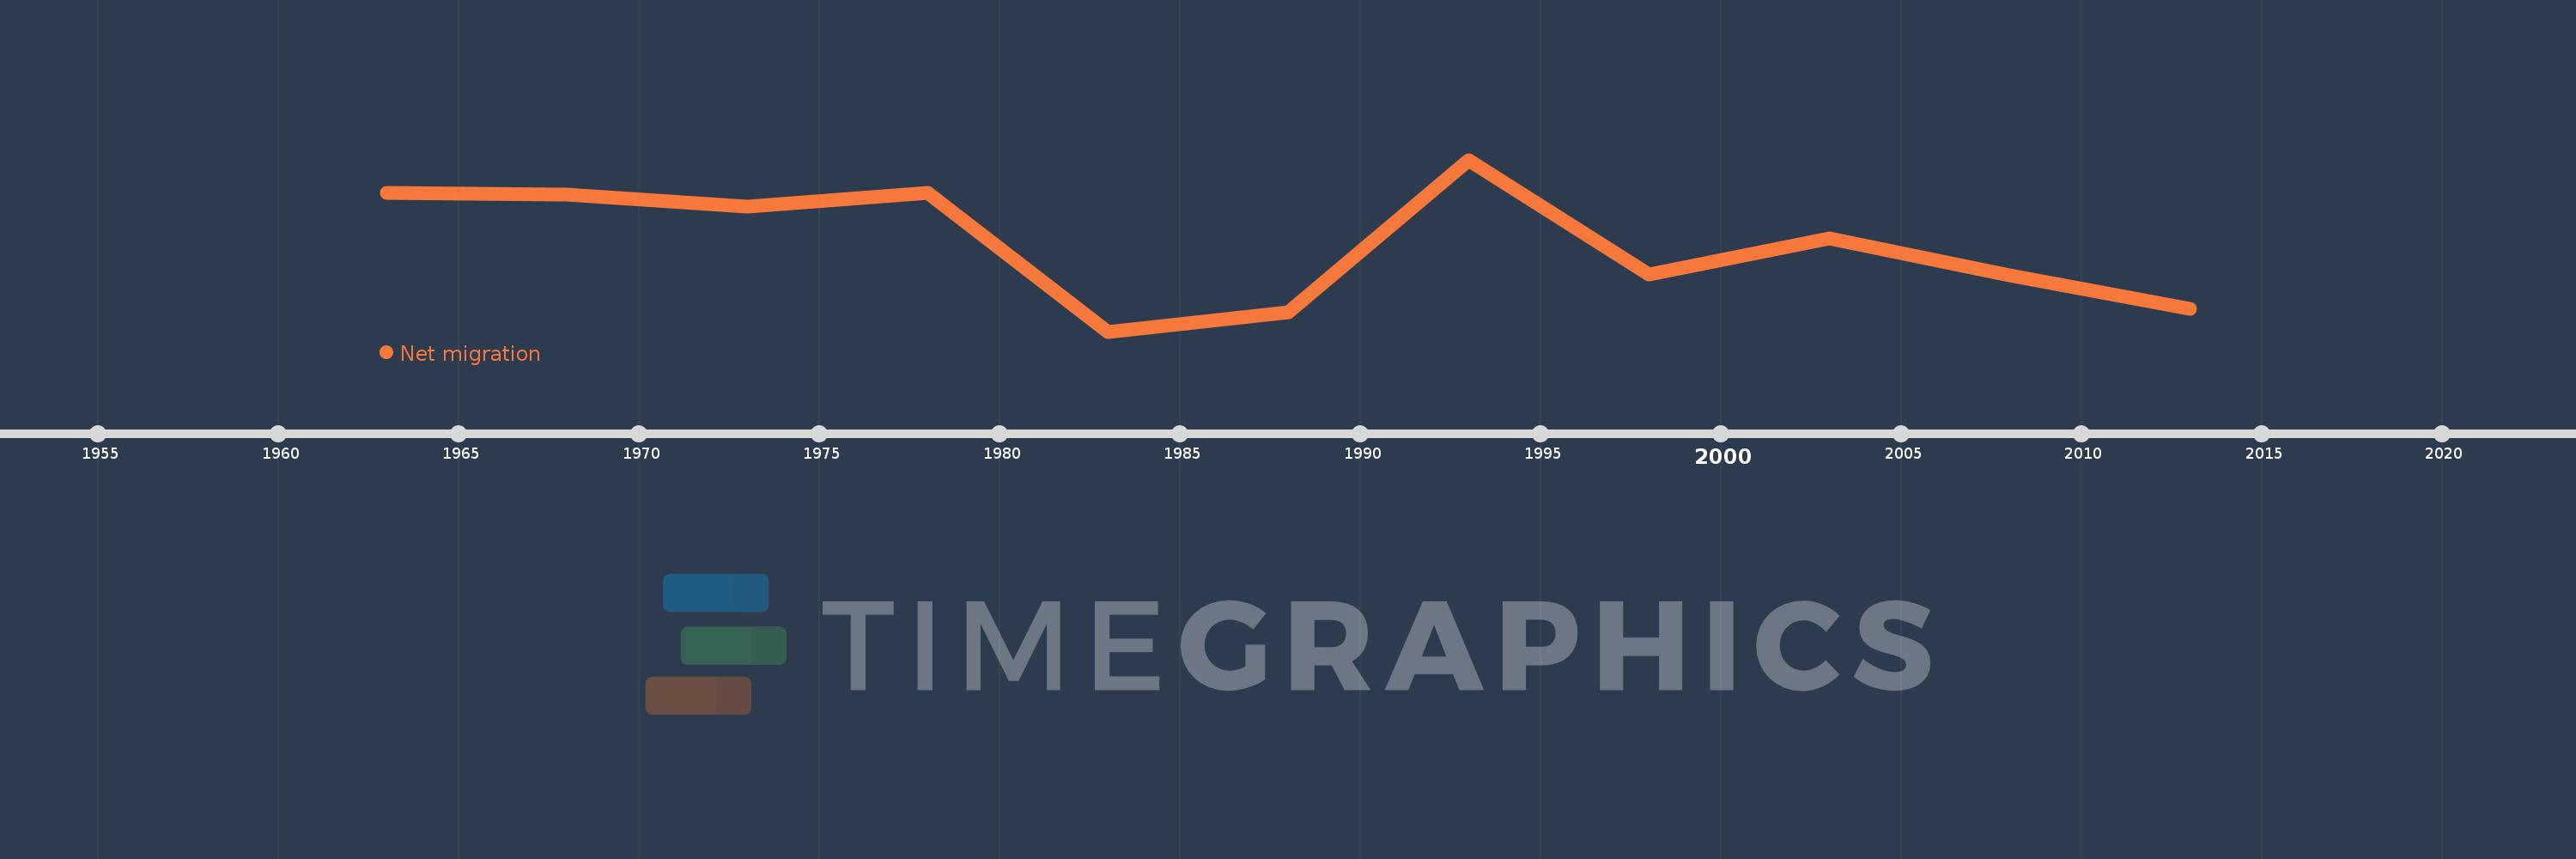
This timeline shows a graph from 1963 to 2013 of Fragile and conflict affected situations. No data until 1962. Number of actual observations by date: 11.
Source name:
World Development Indicators
Source organization:
United Nations Population Division, World Population Prospects.
Categories, topics:
Financial Sector, Health, Aid Effectiveness
Last updated:
apr 23, 2017
Indicators value changes by year
Meaning:
-1.84 mln
Minimum:
-4.786 mln
jan 1, 1983
Maximum:
1.012 mln
jan 1, 1993
At the date of observation
Value
Absolute change
Change from the previous value
jan 1, 1963
-118.109K
-118.109K
0.0%
jan 1, 1968
-157.483K
-39.374K
33.34%
jan 1, 1973
-556.738K
-399.255K
253.52%
jan 1, 1978
-100.562K
+456.176K
-81.94%
jan 1, 1983
-4.786 mln
-4.685 mln
4.66K%
jan 1, 1988
-4.144 mln
+642.013K
-13.41%
jan 1, 1993
1.012 mln
+5.156 mln
-124.43%
jan 1, 1998
-2.846 mln
-3.858 mln
-381.1%
jan 1, 2003
-1.639 mln
+1.207 mln
-42.41%
jan 1, 2008
-2.889 mln
-1.25 mln
76.3%
jan 1, 2013
-4.019 mln
-1.13 mln
39.11%
Ranking of countries by current statistics by years