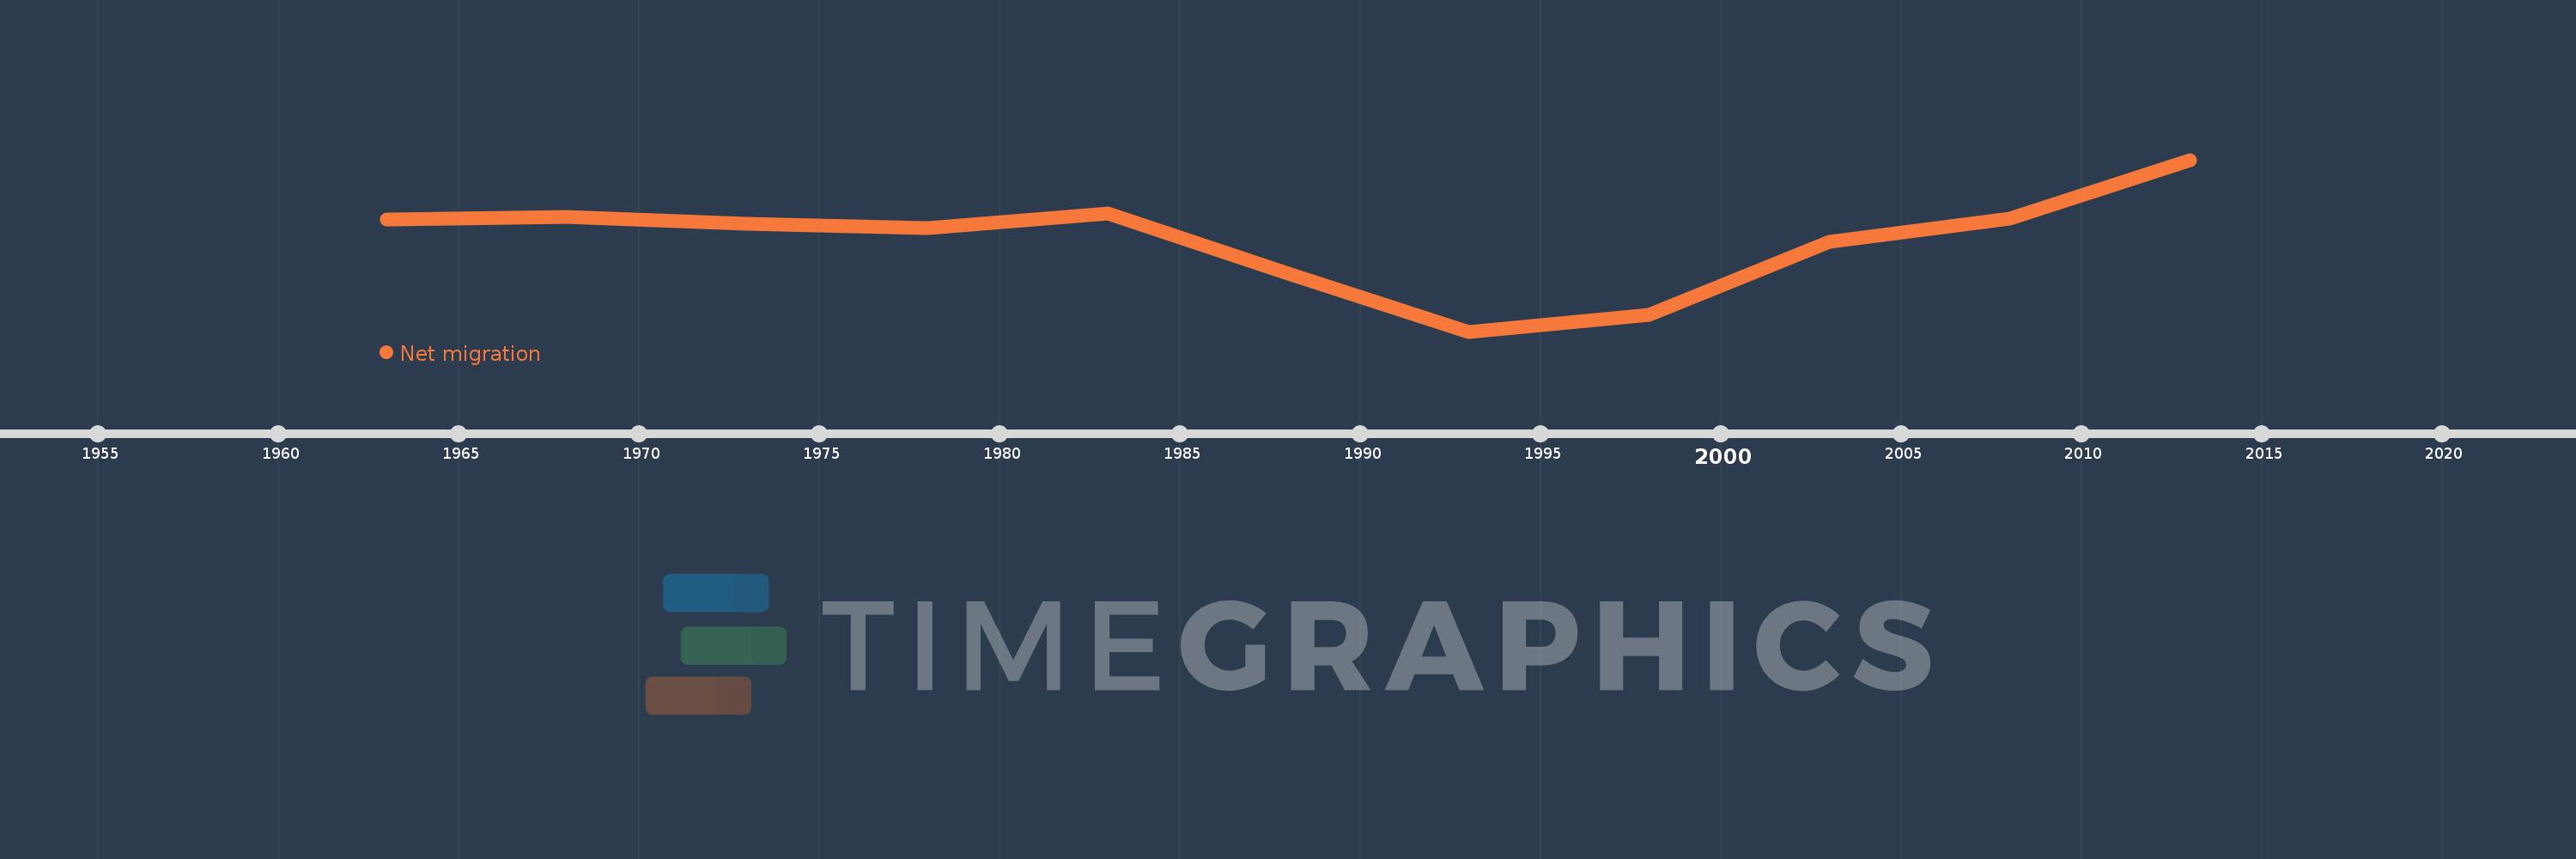
This timeline shows a graph from 1963 to 2013 of Europe & Central Asia (IDA & IBRD countries). No data until 1962. Number of actual observations by date: 11.
Source name:
World Development Indicators
Source organization:
United Nations Population Division, World Population Prospects.
Categories, topics:
Financial Sector, Health, Aid Effectiveness
Last updated:
apr 23, 2017
Indicators value changes by year
Meaning:
-702.668K
Minimum:
-3.803 mln
jan 1, 1993
Maximum:
2.027 mln
jan 1, 2013
At the date of observation
Value
Absolute change
Change from the previous value
jan 1, 1963
1.896K
+1.896K
0.0%
jan 1, 1968
80.479K
+78.583K
4.14K%
jan 1, 1973
-157.523K
-238.002K
-295.73%
jan 1, 1978
-290.303K
-132.78K
84.29%
jan 1, 1983
209.962K
+500.265K
-172.33%
jan 1, 1988
-1.84 mln
-2.05 mln
-976.16%
jan 1, 1993
-3.803 mln
-1.964 mln
106.75%
jan 1, 1998
-3.241 mln
+561.809K
-14.77%
jan 1, 2003
-758.482K
+2.483 mln
-76.6%
jan 1, 2008
41.666K
+800.148K
-105.49%
jan 1, 2013
2.027 mln
+1.986 mln
4.77K%
Ranking of countries by current statistics by years