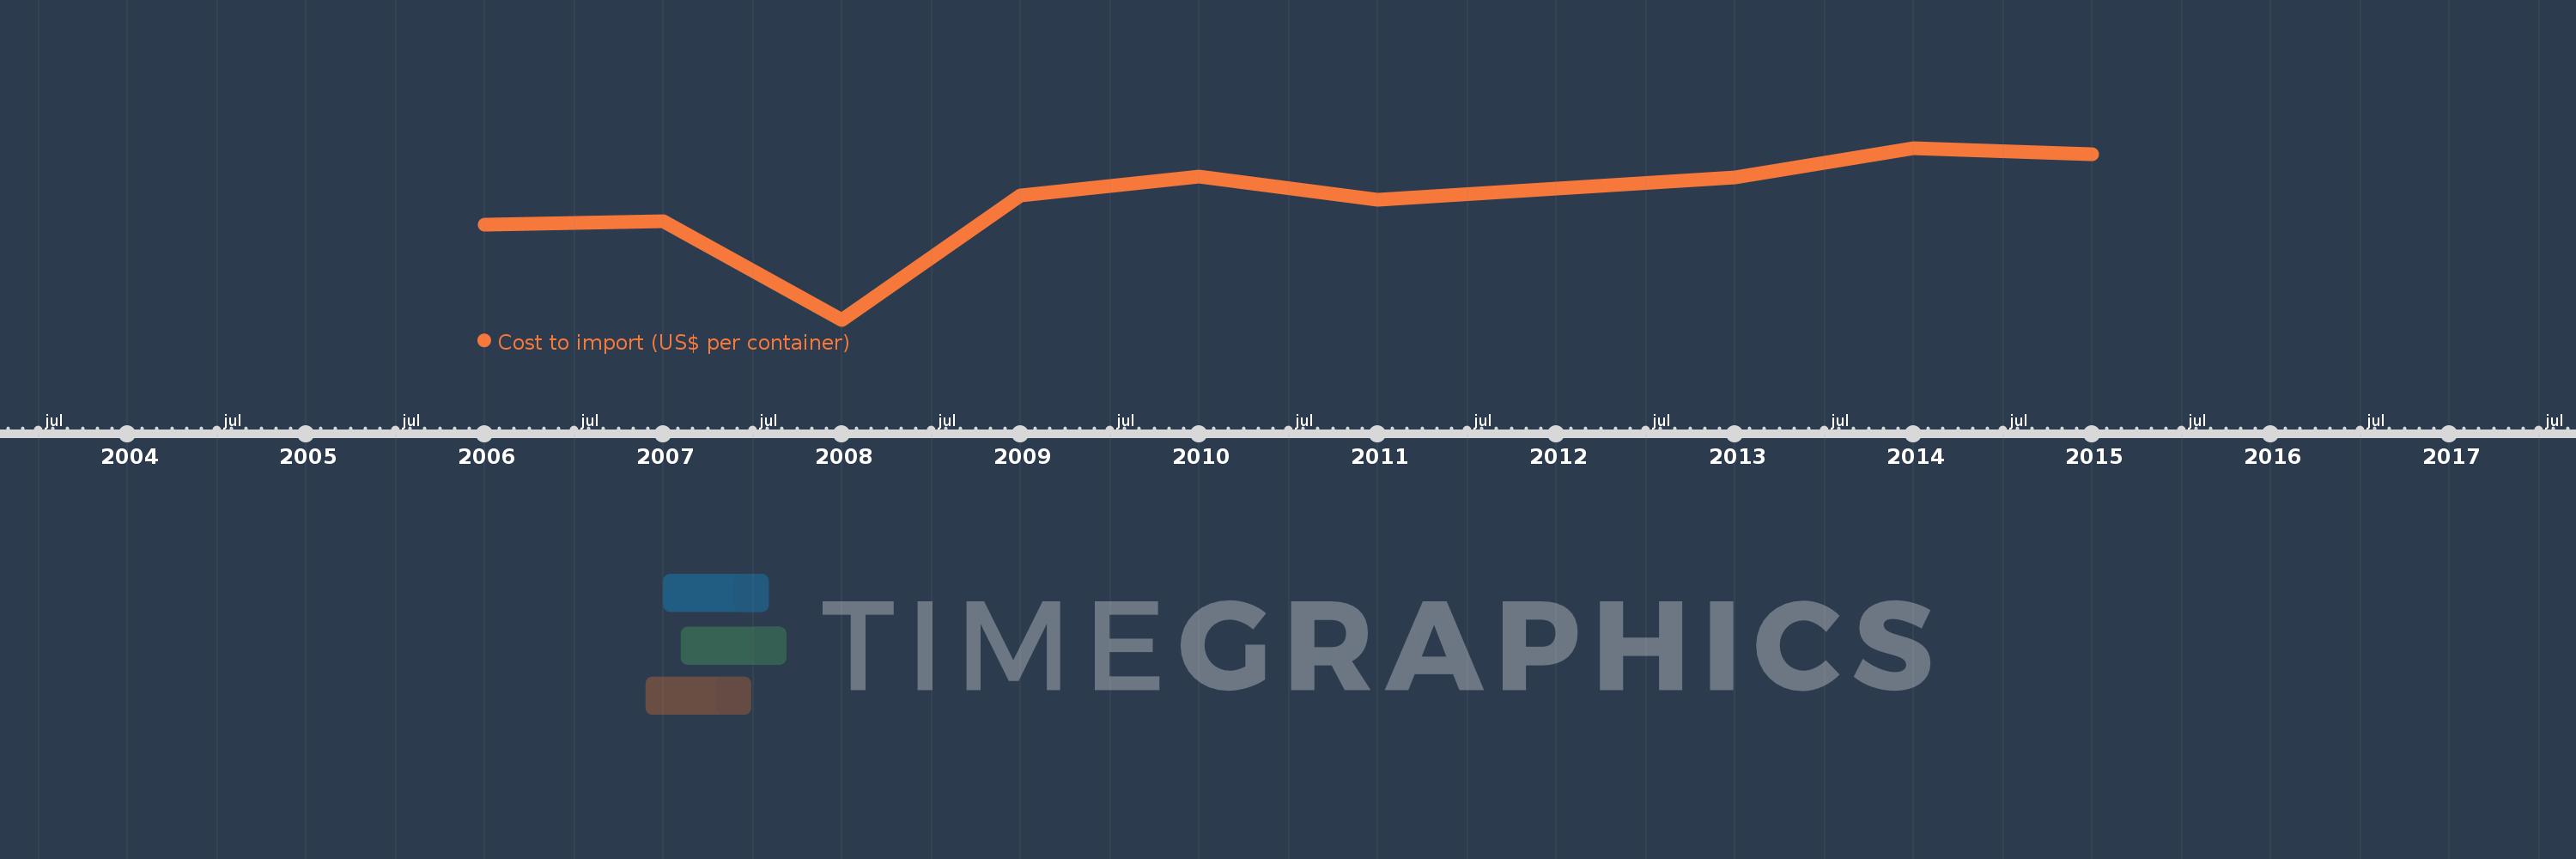
This timeline shows a graph from 2006 to 2015 of Middle East & North Africa (IDA & IBRD countries). No data until 2005. Number of actual observations by date: 10.
Source name:
World Development Indicators
Source organization:
World Bank, Doing Business project (http://www.doingbusiness.org/).
Categories, topics:
Private Sector, Trade
Last updated:
apr 23, 2017
Indicators value changes by year
Meaning:
1.442K
Minimum:
1.303K
jan 1, 2008
Maximum:
1.502K
jan 1, 2014
At the date of observation
Value
Absolute change
Change from the previous value
jan 1, 2006
1.413K
+1.413K
0.0%
jan 1, 2007
1.418K
+4.364
0.31%
jan 1, 2008
1.303K
-114.545
-8.08%
jan 1, 2009
1.448K
+144.455
11.08%
jan 1, 2010
1.47K
+22.0
1.52%
jan 1, 2011
1.442K
-27.636
-1.88%
jan 1, 2012
1.456K
+13.636
0.95%
jan 1, 2013
1.469K
+13.03
0.9%
jan 1, 2014
1.502K
+33.833
2.3%
jan 1, 2015
1.495K
-7.5
-0.5%
Ranking of countries by current statistics by years