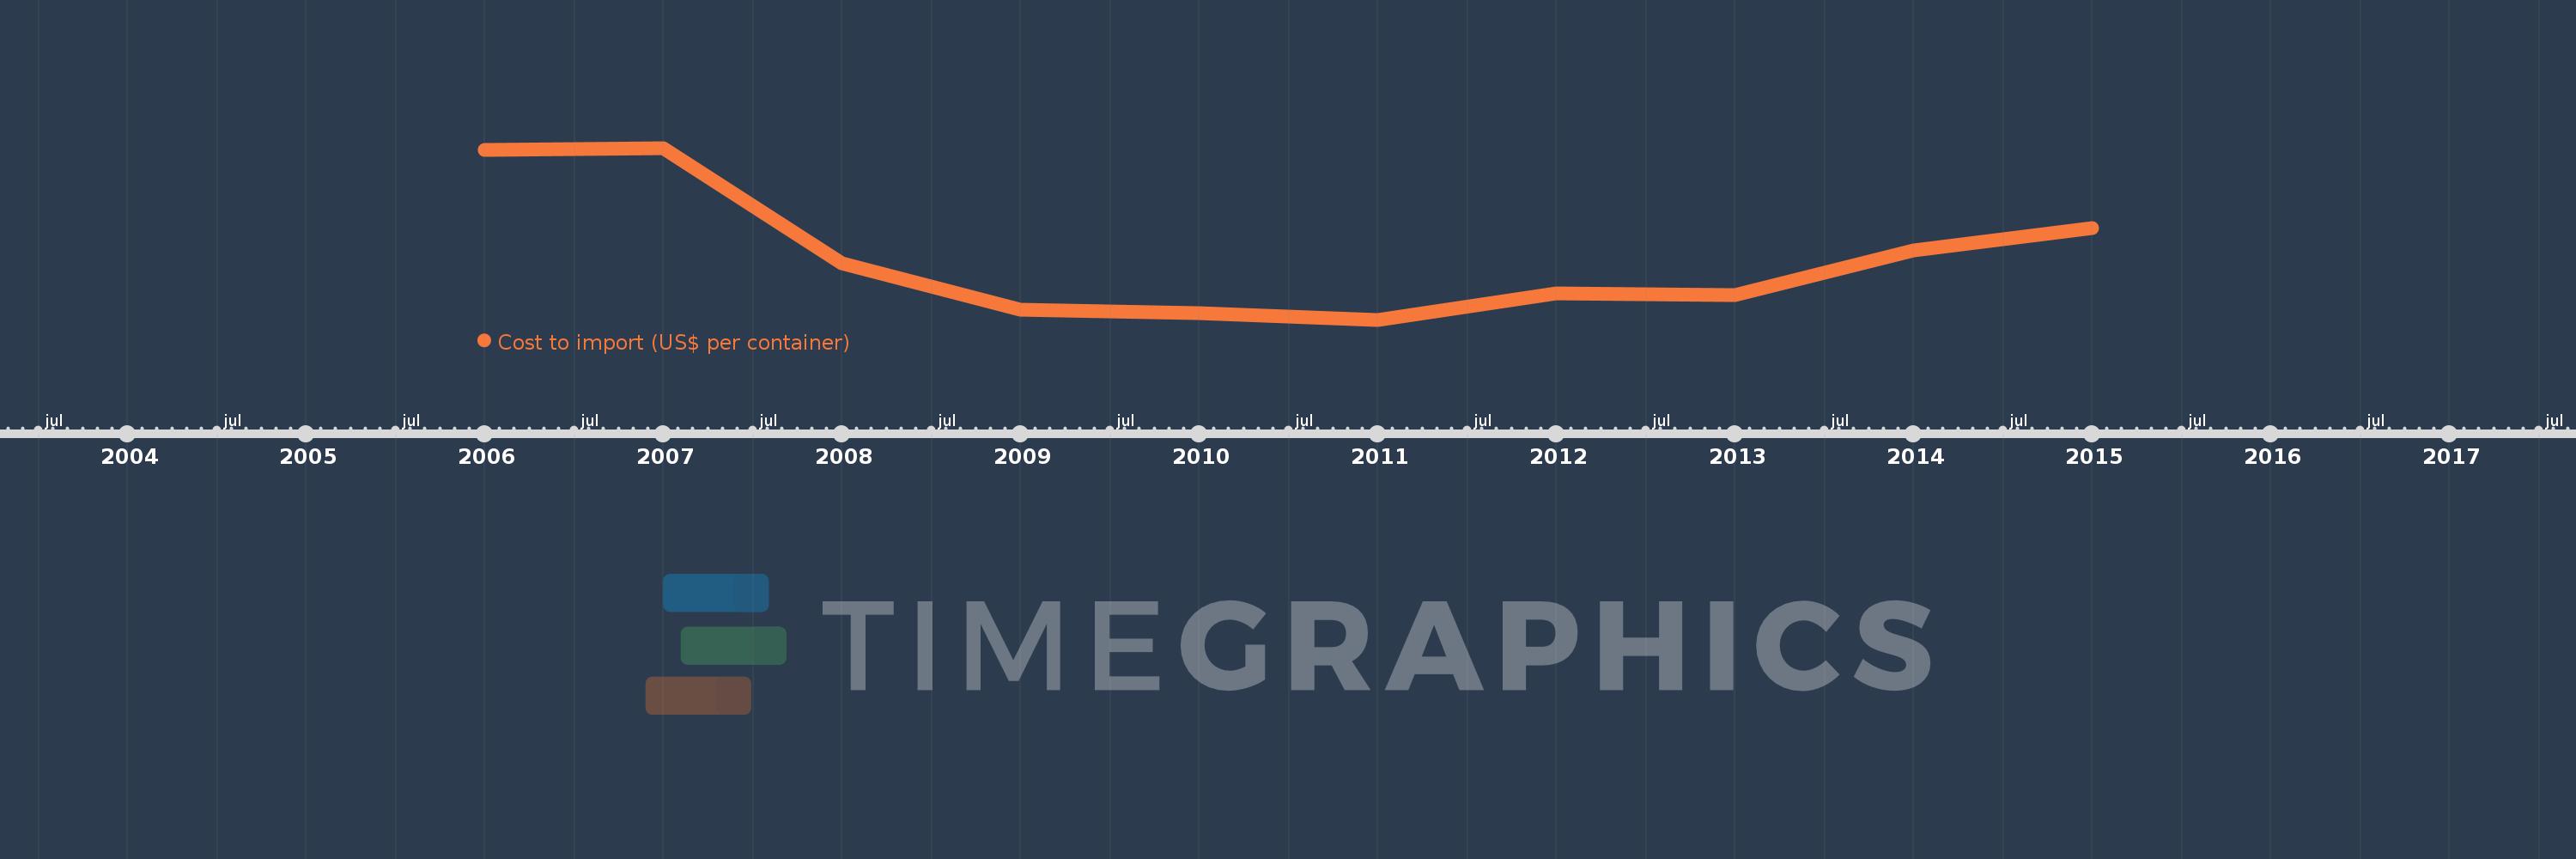
This timeline shows a graph from 2006 to 2015 of East Asia & Pacific (IDA & IBRD countries). No data until 2005. Number of actual observations by date: 10.
Source name:
World Development Indicators
Source organization:
World Bank, Doing Business project (http://www.doingbusiness.org/).
Categories, topics:
Private Sector, Trade
Last updated:
apr 23, 2017
Indicators value changes by year
Meaning:
920.934
Minimum:
863.93
jan 1, 2011
Maximum:
1.02K
jan 1, 2007
At the date of observation
Value
Absolute change
Change from the previous value
jan 1, 2006
1.018K
+1.018K
0.0%
jan 1, 2007
1.02K
+1.8
0.18%
jan 1, 2008
915.12
-104.93
-10.29%
jan 1, 2009
873.13
-41.99
-4.59%
jan 1, 2010
870.23
-2.9
-0.33%
jan 1, 2011
863.93
-6.3
-0.72%
jan 1, 2012
887.88
+23.95
2.77%
jan 1, 2013
886.481
-1.399
-0.16%
jan 1, 2014
926.895
+40.414
4.56%
jan 1, 2015
947.371
+20.476
2.21%
Ranking of countries by current statistics by years