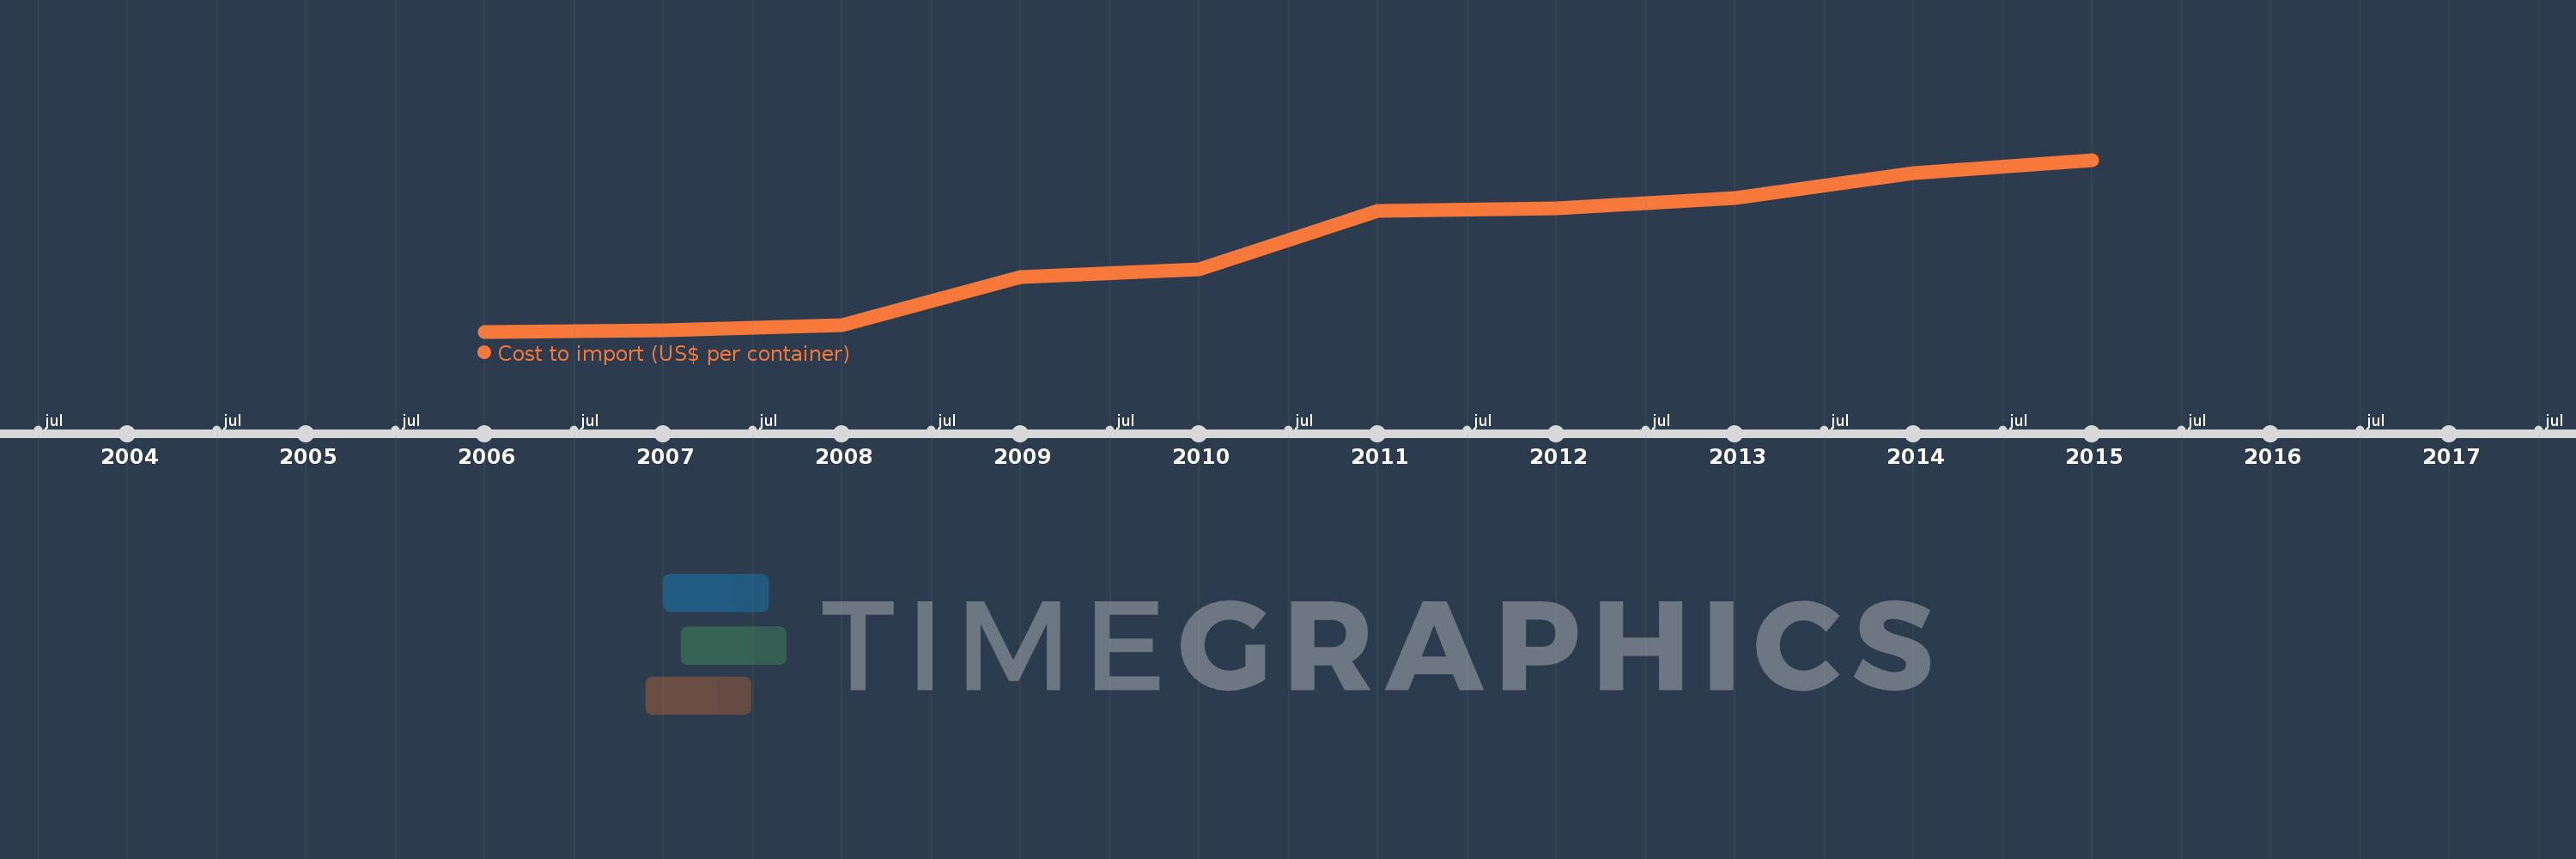
This timeline shows a graph from 2006 to 2015 of Heavily indebted poor countries (HIPC). No data until 2005. Number of actual observations by date: 10.
Source name:
World Development Indicators
Source organization:
World Bank, Doing Business project (http://www.doingbusiness.org/).
Categories, topics:
Private Sector, Trade
Last updated:
apr 23, 2017
Indicators value changes by year
Meaning:
2.459K
Minimum:
2.055K
jan 1, 2006
Maximum:
2.889K
jan 1, 2015
At the date of observation
Value
Absolute change
Change from the previous value
jan 1, 2006
2.055K
+2.055K
0.0%
jan 1, 2007
2.062K
+6.252
0.3%
jan 1, 2008
2.086K
+24.684
1.2%
jan 1, 2009
2.318K
+231.763
11.11%
jan 1, 2010
2.358K
+39.658
1.71%
jan 1, 2011
2.639K
+281.263
11.93%
jan 1, 2012
2.654K
+14.816
0.56%
jan 1, 2013
2.704K
+50.289
1.89%
jan 1, 2014
2.826K
+121.711
4.5%
jan 1, 2015
2.889K
+63.079
2.23%
Ranking of countries by current statistics by years