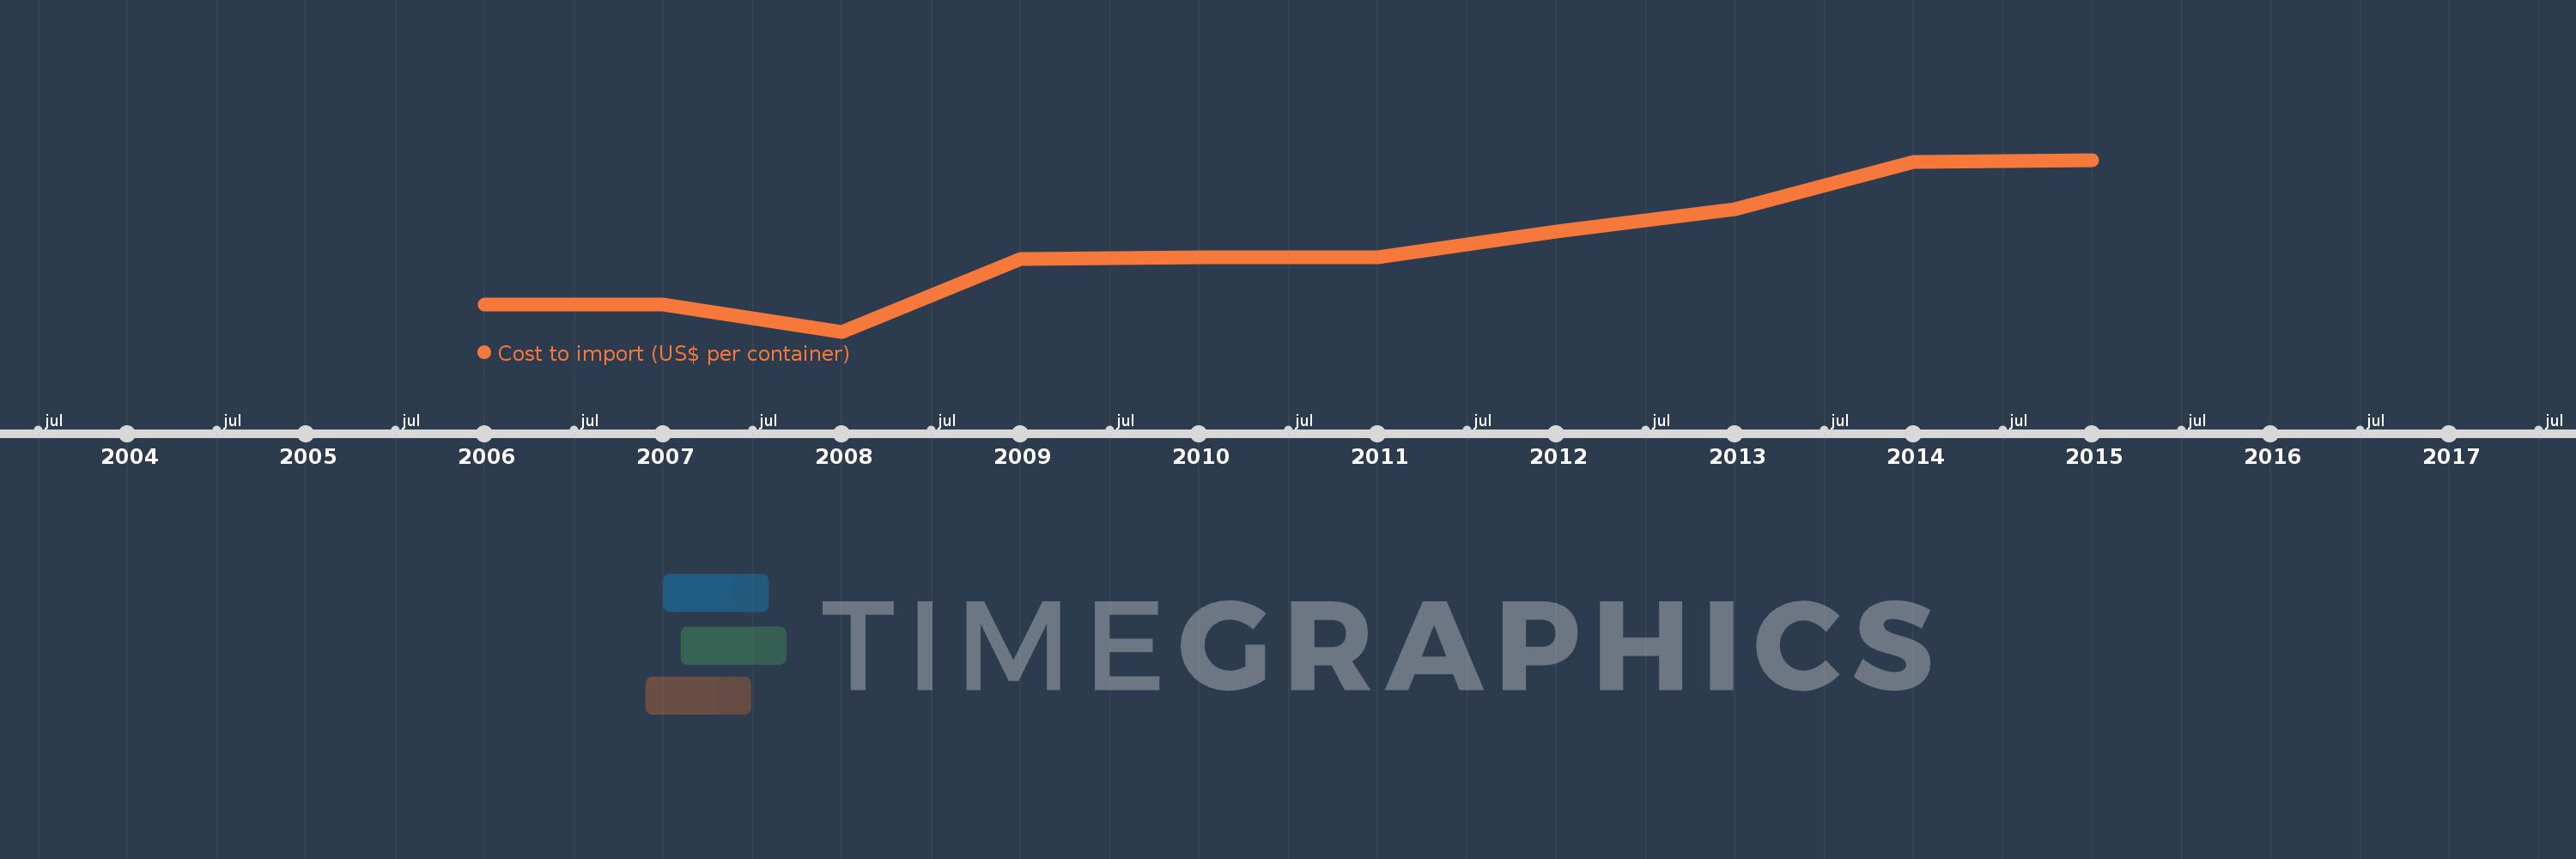
This timeline shows a graph from 2006 to 2015 of Latin America & the Caribbean (IDA & IBRD countries). No data until 2005. Number of actual observations by date: 10.
Source name:
World Development Indicators
Source organization:
World Bank, Doing Business project (http://www.doingbusiness.org/).
Categories, topics:
Private Sector, Trade
Last updated:
apr 23, 2017
Indicators value changes by year
Meaning:
1.492K
Minimum:
1.318K
jan 1, 2008
Maximum:
1.675K
jan 1, 2015
At the date of observation
Value
Absolute change
Change from the previous value
jan 1, 2006
1.374K
+1.374K
0.0%
jan 1, 2007
1.375K
+1.133
0.08%
jan 1, 2008
1.318K
-56.867
-4.14%
jan 1, 2009
1.469K
+150.84
11.45%
jan 1, 2010
1.473K
+4.123
0.28%
jan 1, 2011
1.473K
+0.16
0.01%
jan 1, 2012
1.525K
+52.167
3.54%
jan 1, 2013
1.573K
+47.6
3.12%
jan 1, 2014
1.67K
+96.857
6.16%
jan 1, 2015
1.675K
+5.05
0.3%
Ranking of countries by current statistics by years