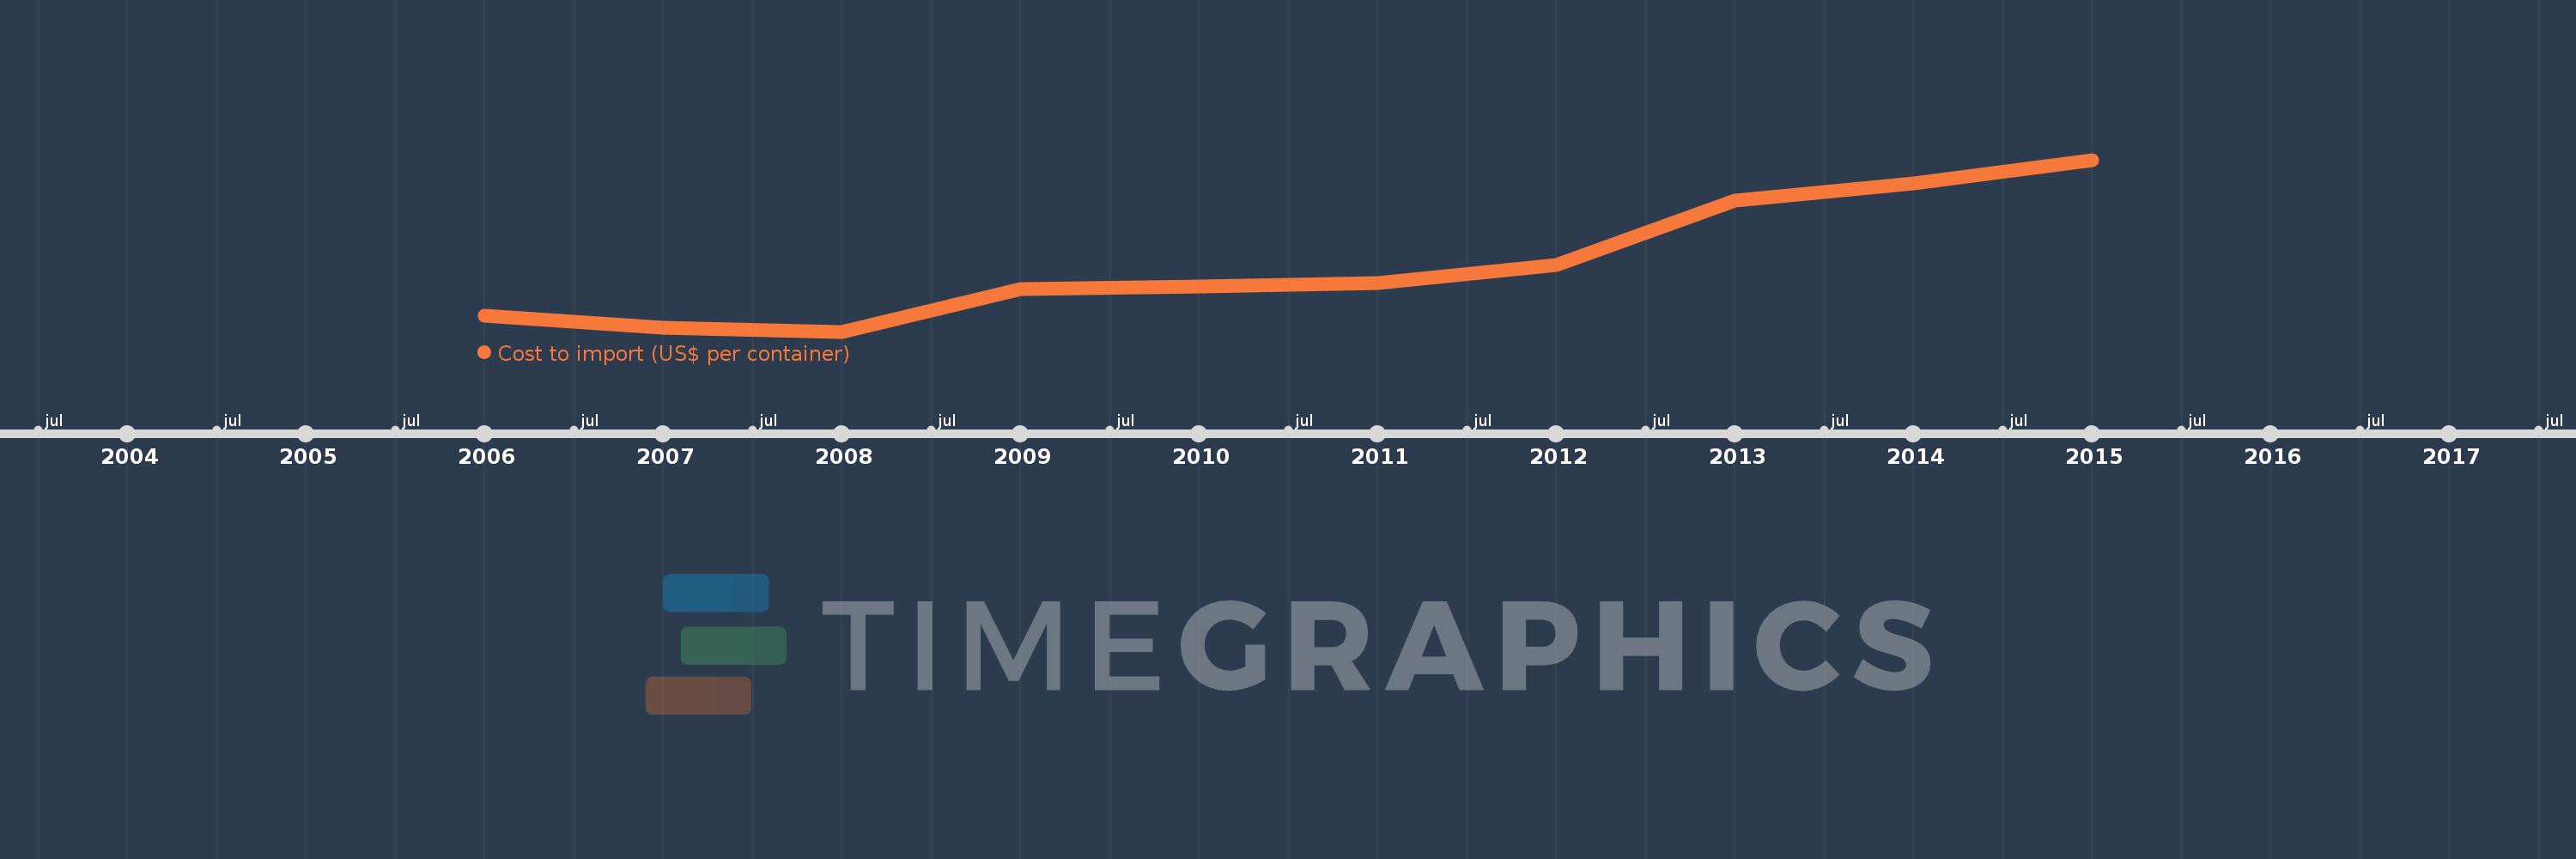
This timeline shows a graph from 2006 to 2015 of Europe & Central Asia (IDA & IBRD countries). No data until 2005. Number of actual observations by date: 10.
Source name:
World Development Indicators
Source organization:
World Bank, Doing Business project (http://www.doingbusiness.org/).
Categories, topics:
Private Sector, Trade
Last updated:
apr 23, 2017
Indicators value changes by year
Meaning:
2.121K
Minimum:
1.76K
jan 1, 2008
Maximum:
2.682K
jan 1, 2015
At the date of observation
Value
Absolute change
Change from the previous value
jan 1, 2006
1.844K
+1.844K
0.0%
jan 1, 2007
1.779K
-65.199
-3.54%
jan 1, 2008
1.76K
-18.857
-1.06%
jan 1, 2009
1.989K
+229.0
13.01%
jan 1, 2010
2.001K
+12.313
0.62%
jan 1, 2011
2.019K
+17.318
0.87%
jan 1, 2012
2.118K
+99.273
4.92%
jan 1, 2013
2.462K
+344.432
16.26%
jan 1, 2014
2.556K
+93.977
3.82%
jan 1, 2015
2.682K
+125.909
4.93%
Ranking of countries by current statistics by years