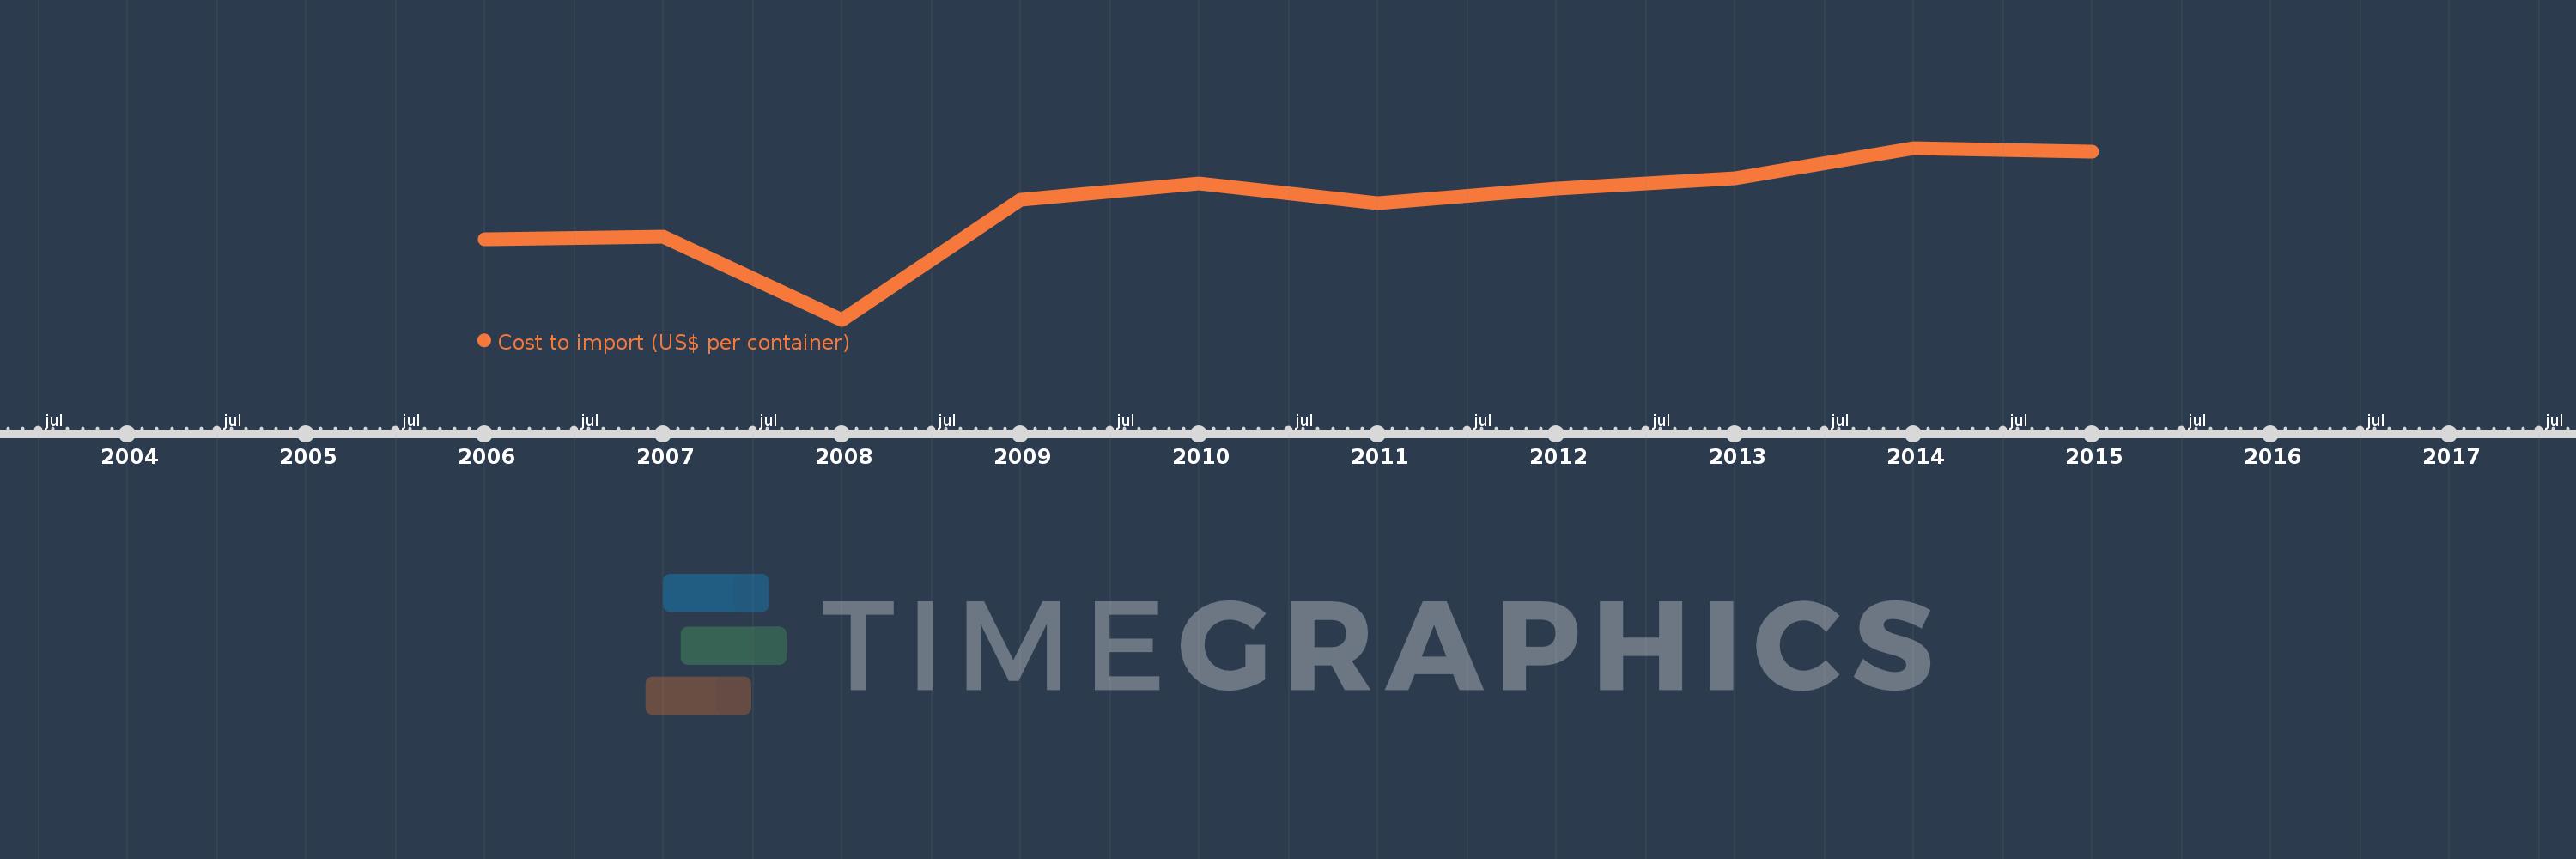
This timeline shows a graph from 2006 to 2015 of Middle East & North Africa (excluding high income). No data until 2005. Number of actual observations by date: 10.
Source name:
World Development Indicators
Source organization:
World Bank, Doing Business project (http://www.doingbusiness.org/).
Categories, topics:
Private Sector, Trade
Last updated:
apr 23, 2017
Indicators value changes by year
Meaning:
1.422K
Minimum:
1.278K
jan 1, 2008
Maximum:
1.494K
jan 1, 2014
At the date of observation
Value
Absolute change
Change from the previous value
jan 1, 2006
1.379K
+1.379K
0.0%
jan 1, 2007
1.383K
+4.0
0.29%
jan 1, 2008
1.278K
-105.0
-7.59%
jan 1, 2009
1.429K
+151.583
11.87%
jan 1, 2010
1.449K
+20.167
1.41%
jan 1, 2011
1.424K
-25.333
-1.75%
jan 1, 2012
1.442K
+18.333
1.29%
jan 1, 2013
1.455K
+13.058
0.91%
jan 1, 2014
1.494K
+38.538
2.65%
jan 1, 2015
1.49K
-4.231
-0.28%
Ranking of countries by current statistics by years