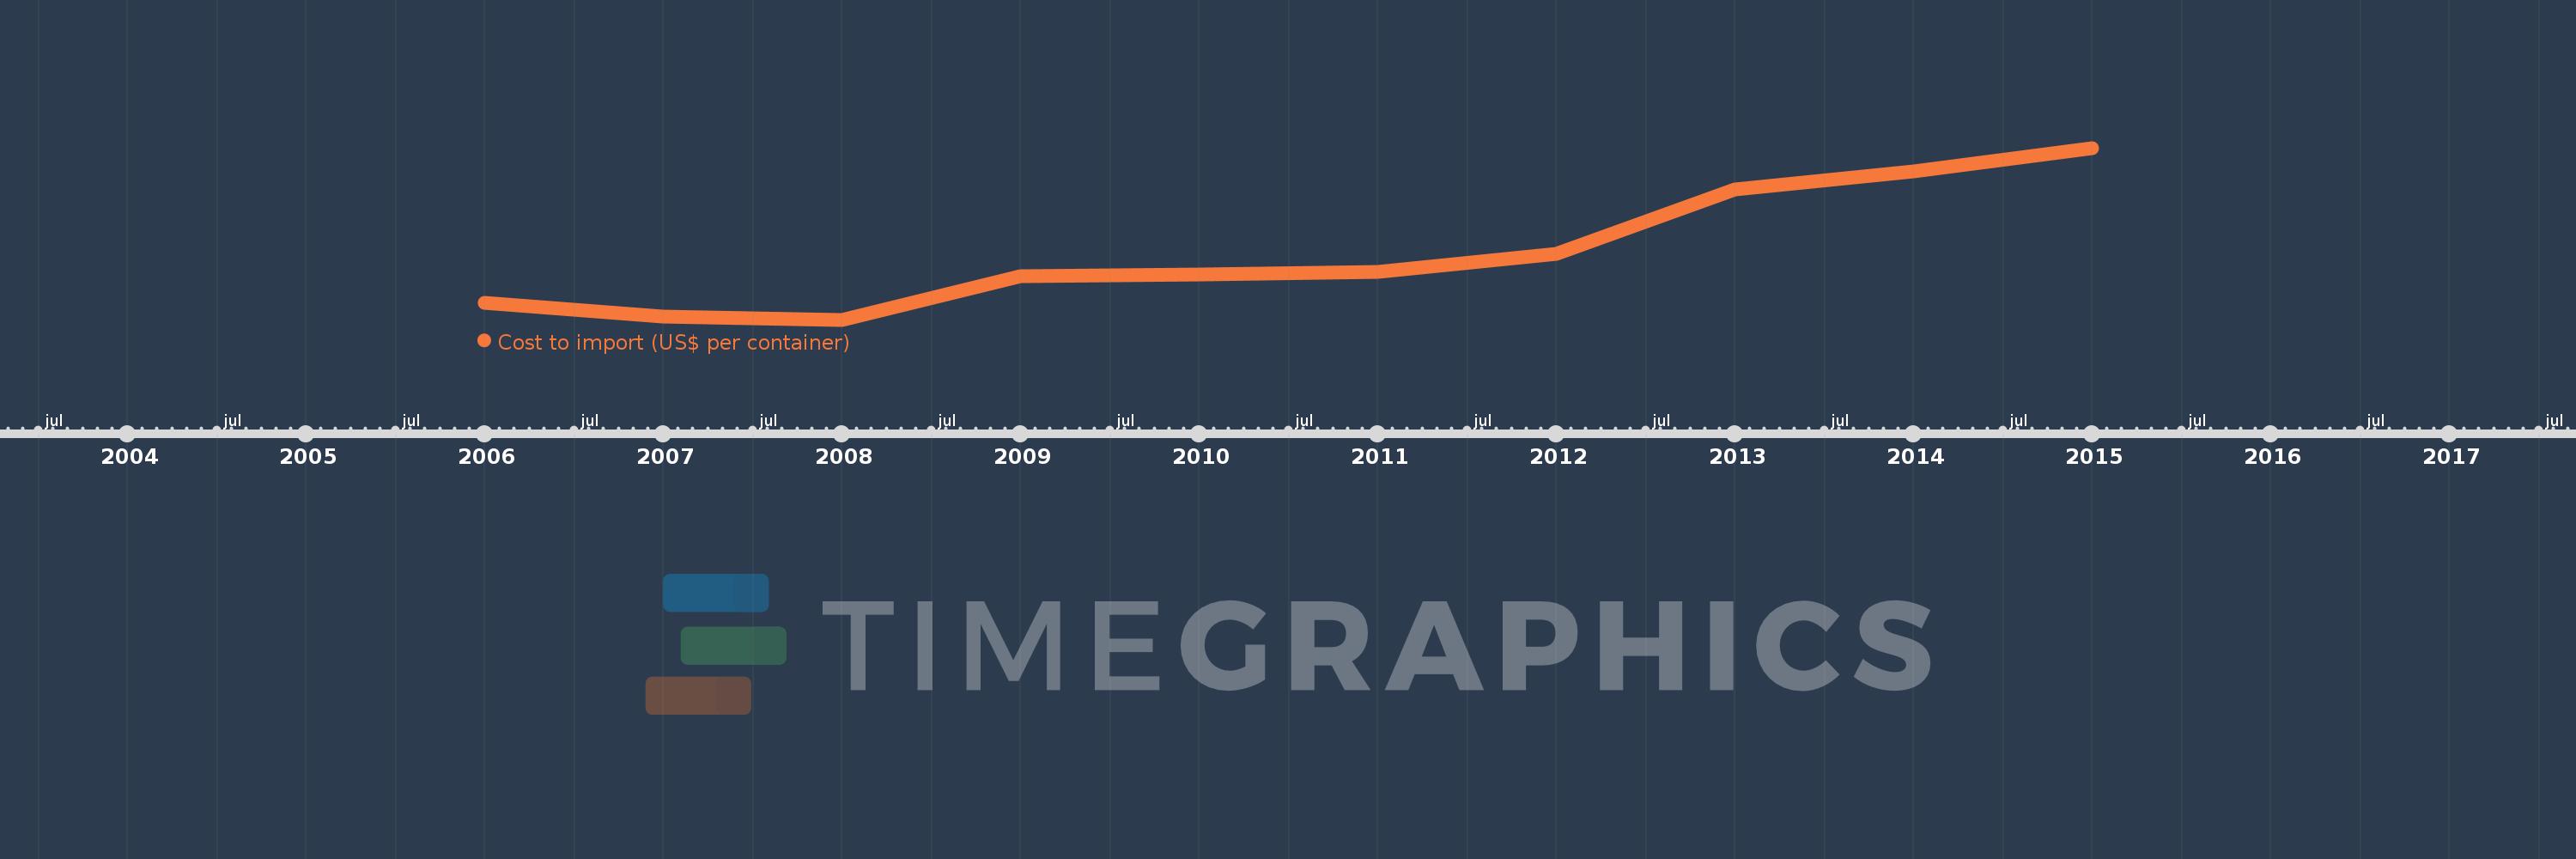
This timeline shows a graph from 2006 to 2015 of Europe & Central Asia (excluding high income). No data until 2005. Number of actual observations by date: 10.
Source name:
World Development Indicators
Source organization:
World Bank, Doing Business project (http://www.doingbusiness.org/).
Categories, topics:
Private Sector, Trade
Last updated:
apr 23, 2017
Indicators value changes by year
Meaning:
2.231K
Minimum:
1.838K
jan 1, 2008
Maximum:
2.84K
jan 1, 2015
At the date of observation
Value
Absolute change
Change from the previous value
jan 1, 2006
1.936K
+1.936K
0.0%
jan 1, 2007
1.859K
-76.899
-3.97%
jan 1, 2008
1.838K
-20.842
-1.12%
jan 1, 2009
2.092K
+253.579
13.79%
jan 1, 2010
2.1K
+8.404
0.4%
jan 1, 2011
2.119K
+19.05
0.91%
jan 1, 2012
2.221K
+101.45
4.79%
jan 1, 2013
2.598K
+377.625
17.0%
jan 1, 2014
2.702K
+103.125
3.97%
jan 1, 2015
2.84K
+138.5
5.13%
Ranking of countries by current statistics by years