Download This statistics in other country:
Timeline:
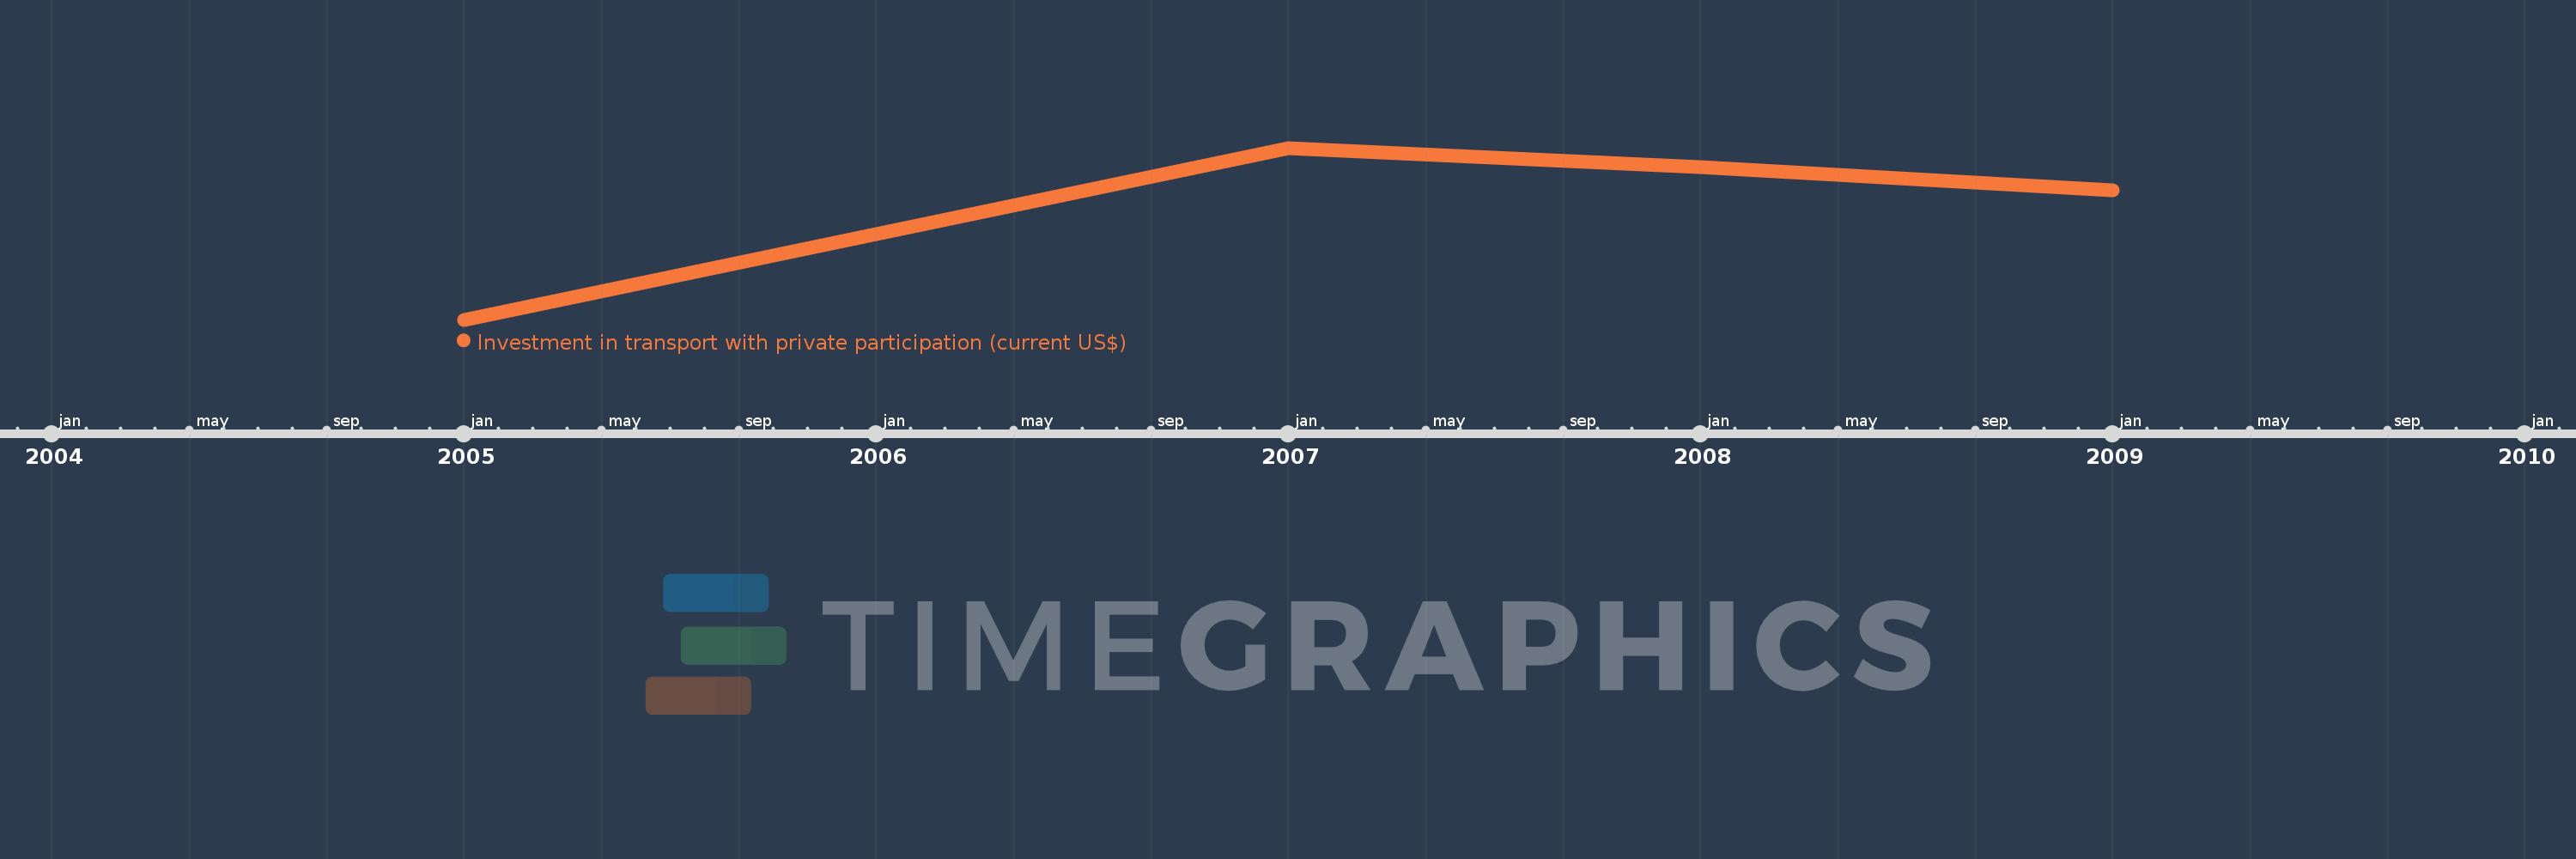
This timeline shows a graph from 2005 to 2009 of Low & middle income. No data until 2004. Number of actual observations by date: 4.
Source name:
World Development Indicators
Source organization:
World Bank, Private Participation in Infrastructure Project Database (http://ppi.worldbank.org).
Categories, topics:
Infrastructure, Private Sector
Last updated:
apr 23, 2017
Indicators value changes by year
Minimum:
4.836 bln
jan 1, 2005
Maximum:
32.443 bln
jan 1, 2007
At the date of observation
Value
Absolute change
Change from the previous value
jan 1, 2005
4.836 bln
+4.836 bln
0.0%
jan 1, 2007
32.443 bln
+27.607 bln
570.88%
jan 1, 2008
29.379 bln
-3.064 bln
-9.44%
jan 1, 2009
25.655 bln
-3.724 bln
-12.68%
Ranking of countries by current statistics by years