Download This statistics in other country:
Timeline:
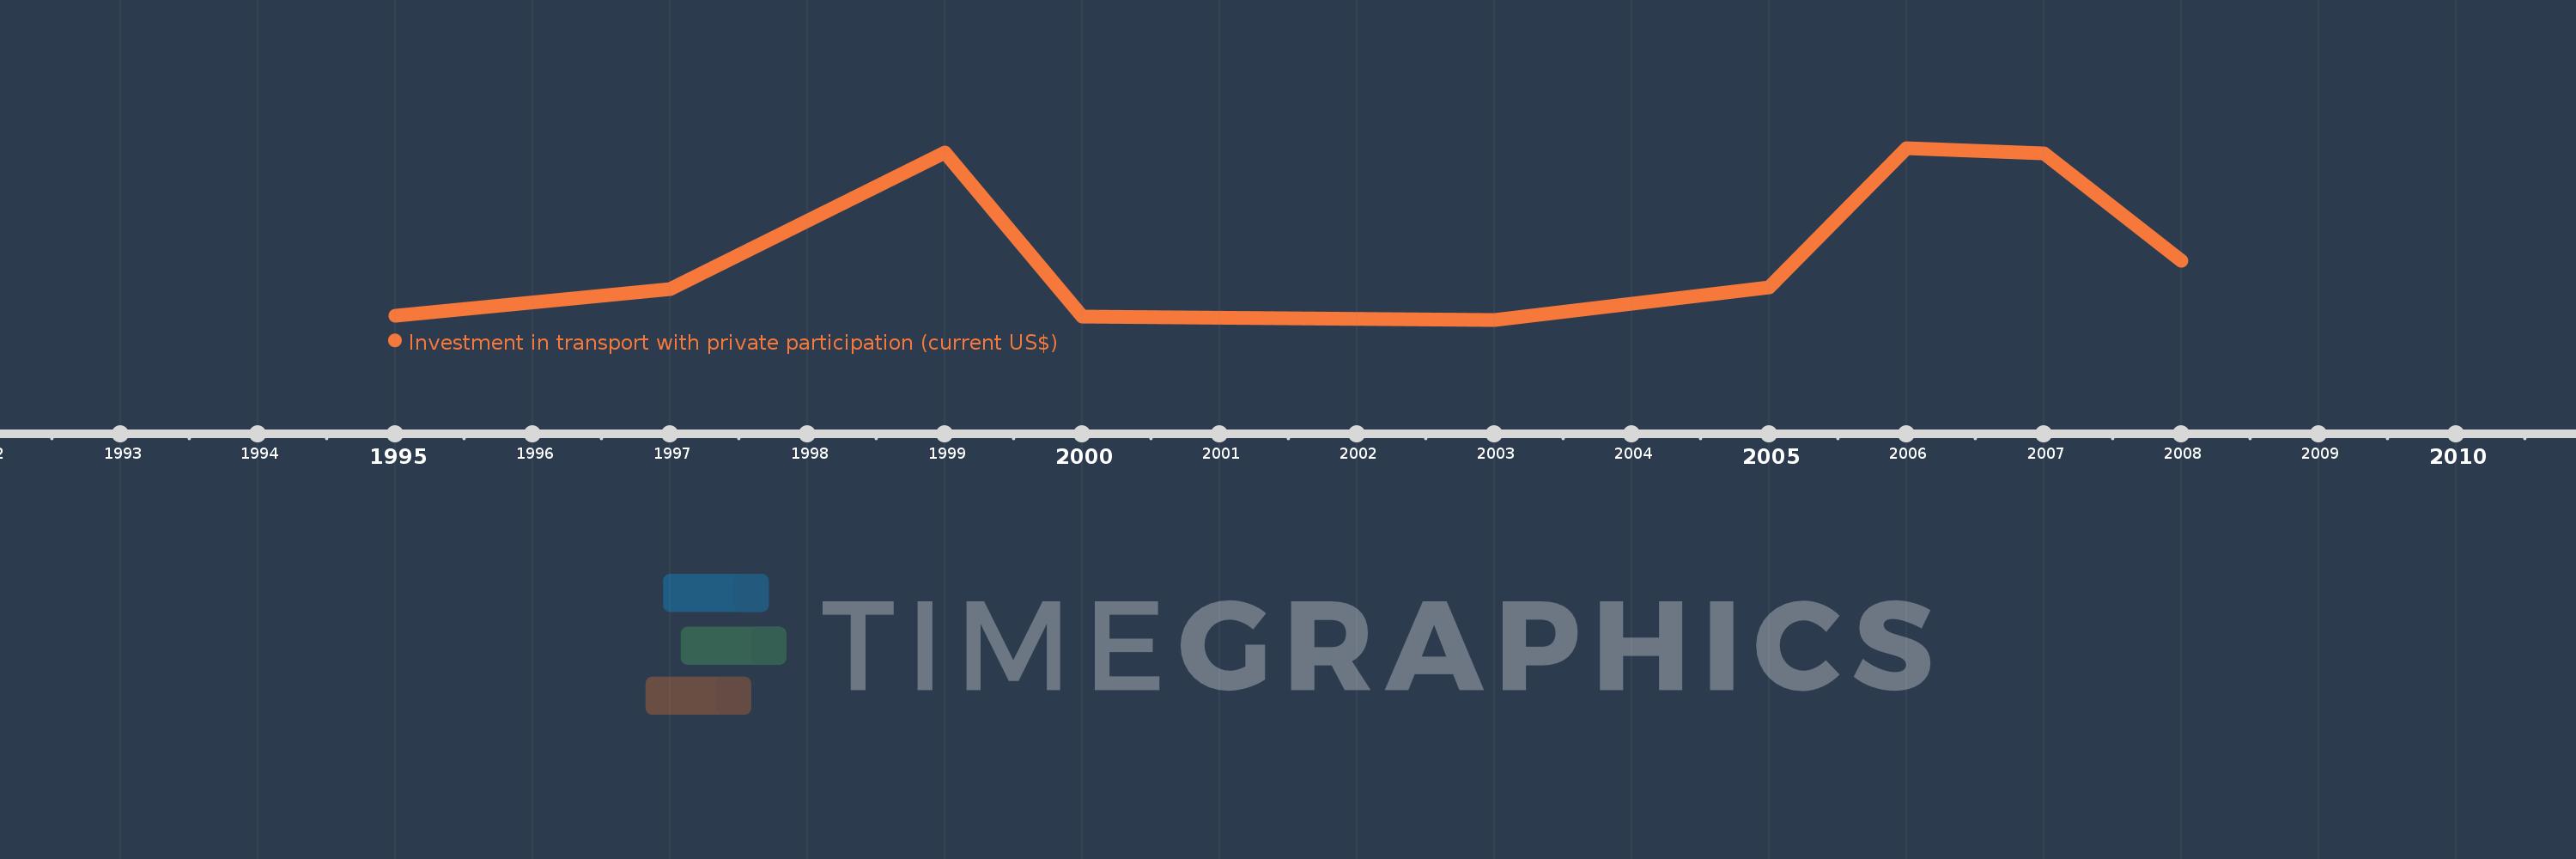
This timeline shows a graph from 1995 to 2008 of Ecuador. No data until 1994. Number of actual observations by date: 9.
Source name:
World Development Indicators
Source organization:
World Bank, Private Participation in Infrastructure Project Database (http://ppi.worldbank.org).
Categories, topics:
Infrastructure, Private Sector
Last updated:
apr 23, 2017
Indicators value changes by year
Maximum:
585.0 mln
jan 1, 2006
At the date of observation
Value
Absolute change
Change from the previous value
jan 1, 1995
12.5 mln
+12.5 mln
0.0%
jan 1, 1997
105.0 mln
+92.5 mln
740.0%
jan 1, 1999
569.8 mln
+464.8 mln
442.67%
jan 1, 2000
12.0 mln
-557.8 mln
-97.89%
jan 1, 2003
0.0
-12.0 mln
-100.0%
jan 1, 2005
110.0 mln
+110.0 mln
%
jan 1, 2006
585.0 mln
+475.0 mln
431.82%
jan 1, 2007
566.0 mln
-19.0 mln
-3.25%
jan 1, 2008
200.0 mln
-366.0 mln
-64.66%
Ranking of countries by current statistics by years