Download This statistics in other country:
Timeline:
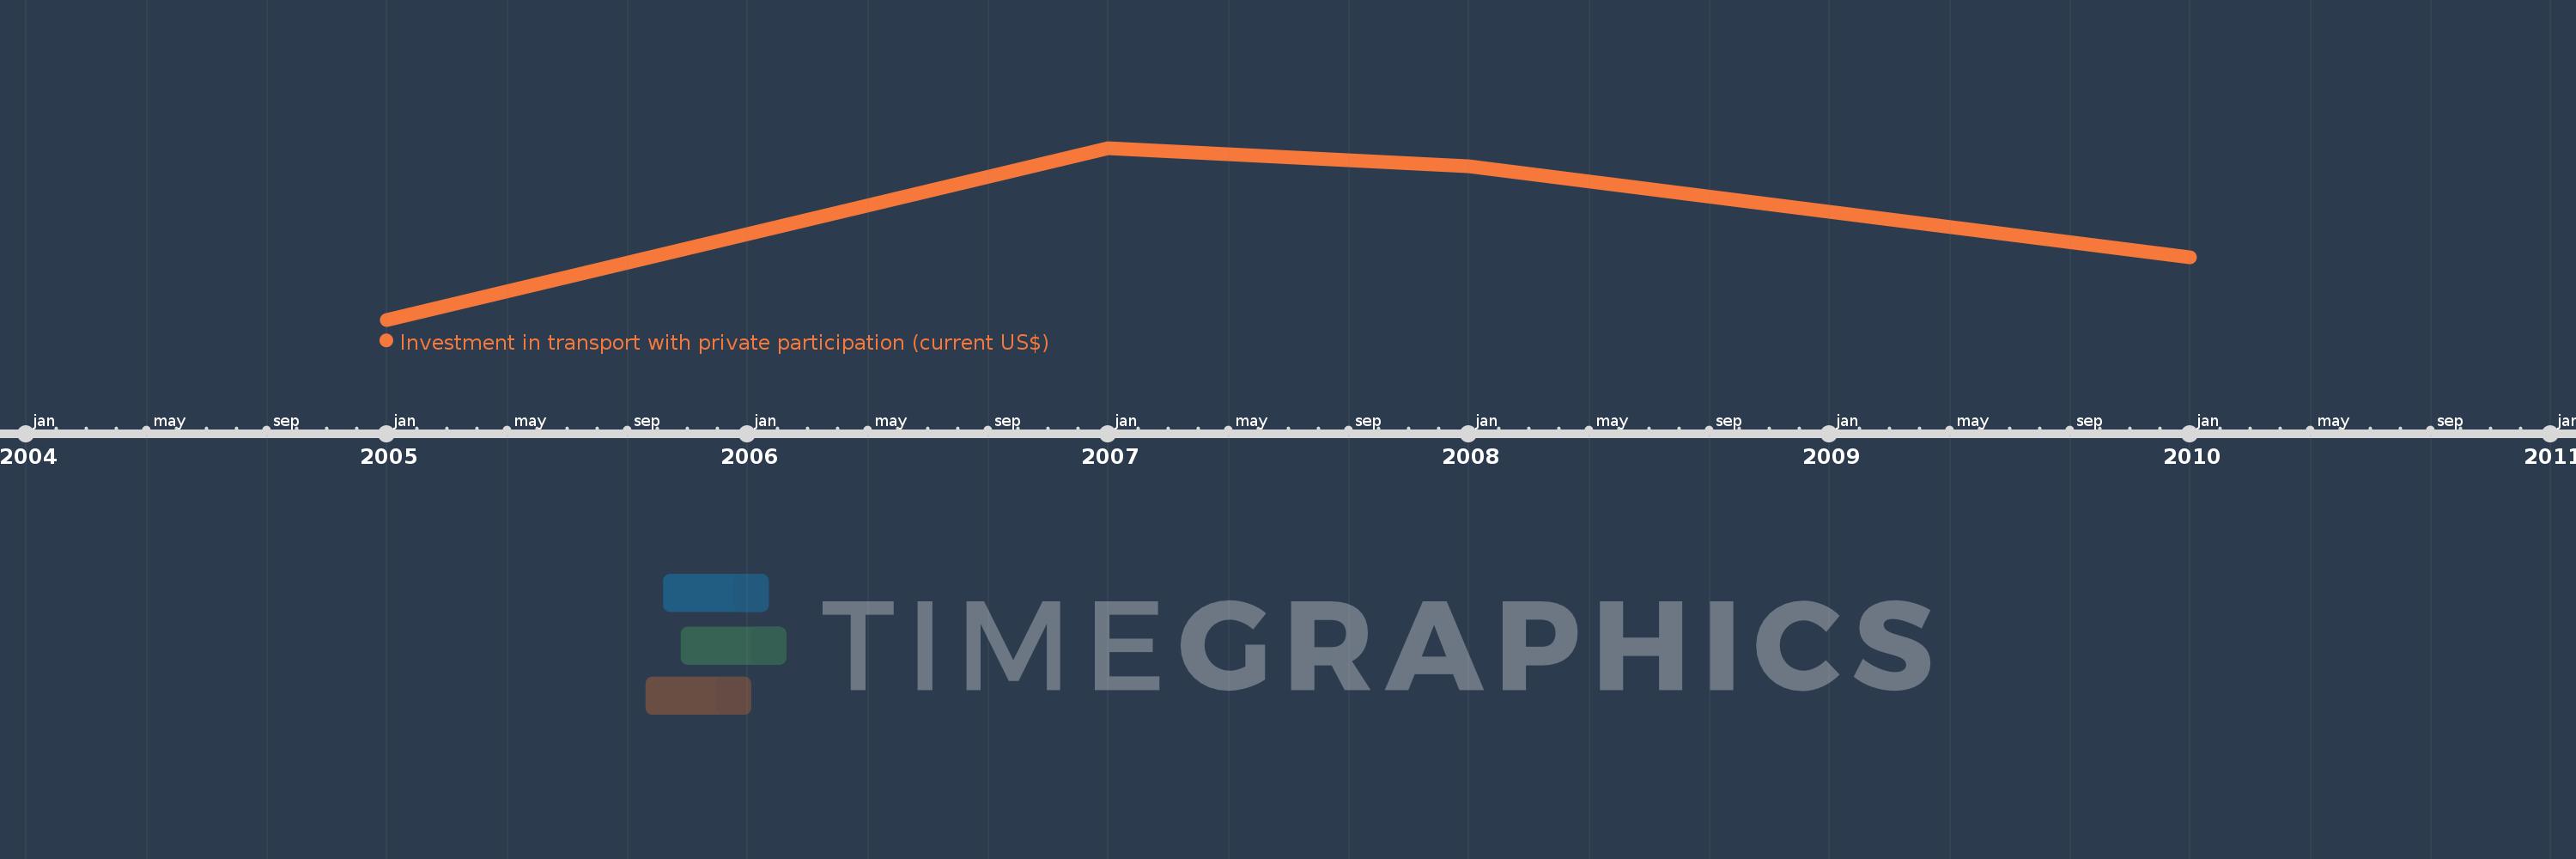
This timeline shows a graph from 2005 to 2010 of Early-demographic dividend. No data until 2004. Number of actual observations by date: 4.
Source name:
World Development Indicators
Source organization:
World Bank, Private Participation in Infrastructure Project Database (http://ppi.worldbank.org).
Categories, topics:
Infrastructure, Private Sector
Last updated:
apr 23, 2017
Indicators value changes by year
Minimum:
2.386 bln
jan 1, 2005
Maximum:
20.055 bln
jan 1, 2007
At the date of observation
Value
Absolute change
Change from the previous value
jan 1, 2005
2.386 bln
+2.386 bln
0.0%
jan 1, 2007
20.055 bln
+17.668 bln
740.41%
jan 1, 2008
18.136 bln
-1.919 bln
-9.57%
jan 1, 2010
8.774 bln
-9.362 bln
-51.62%
Ranking of countries by current statistics by years