Download This statistics in other country:
Timeline:
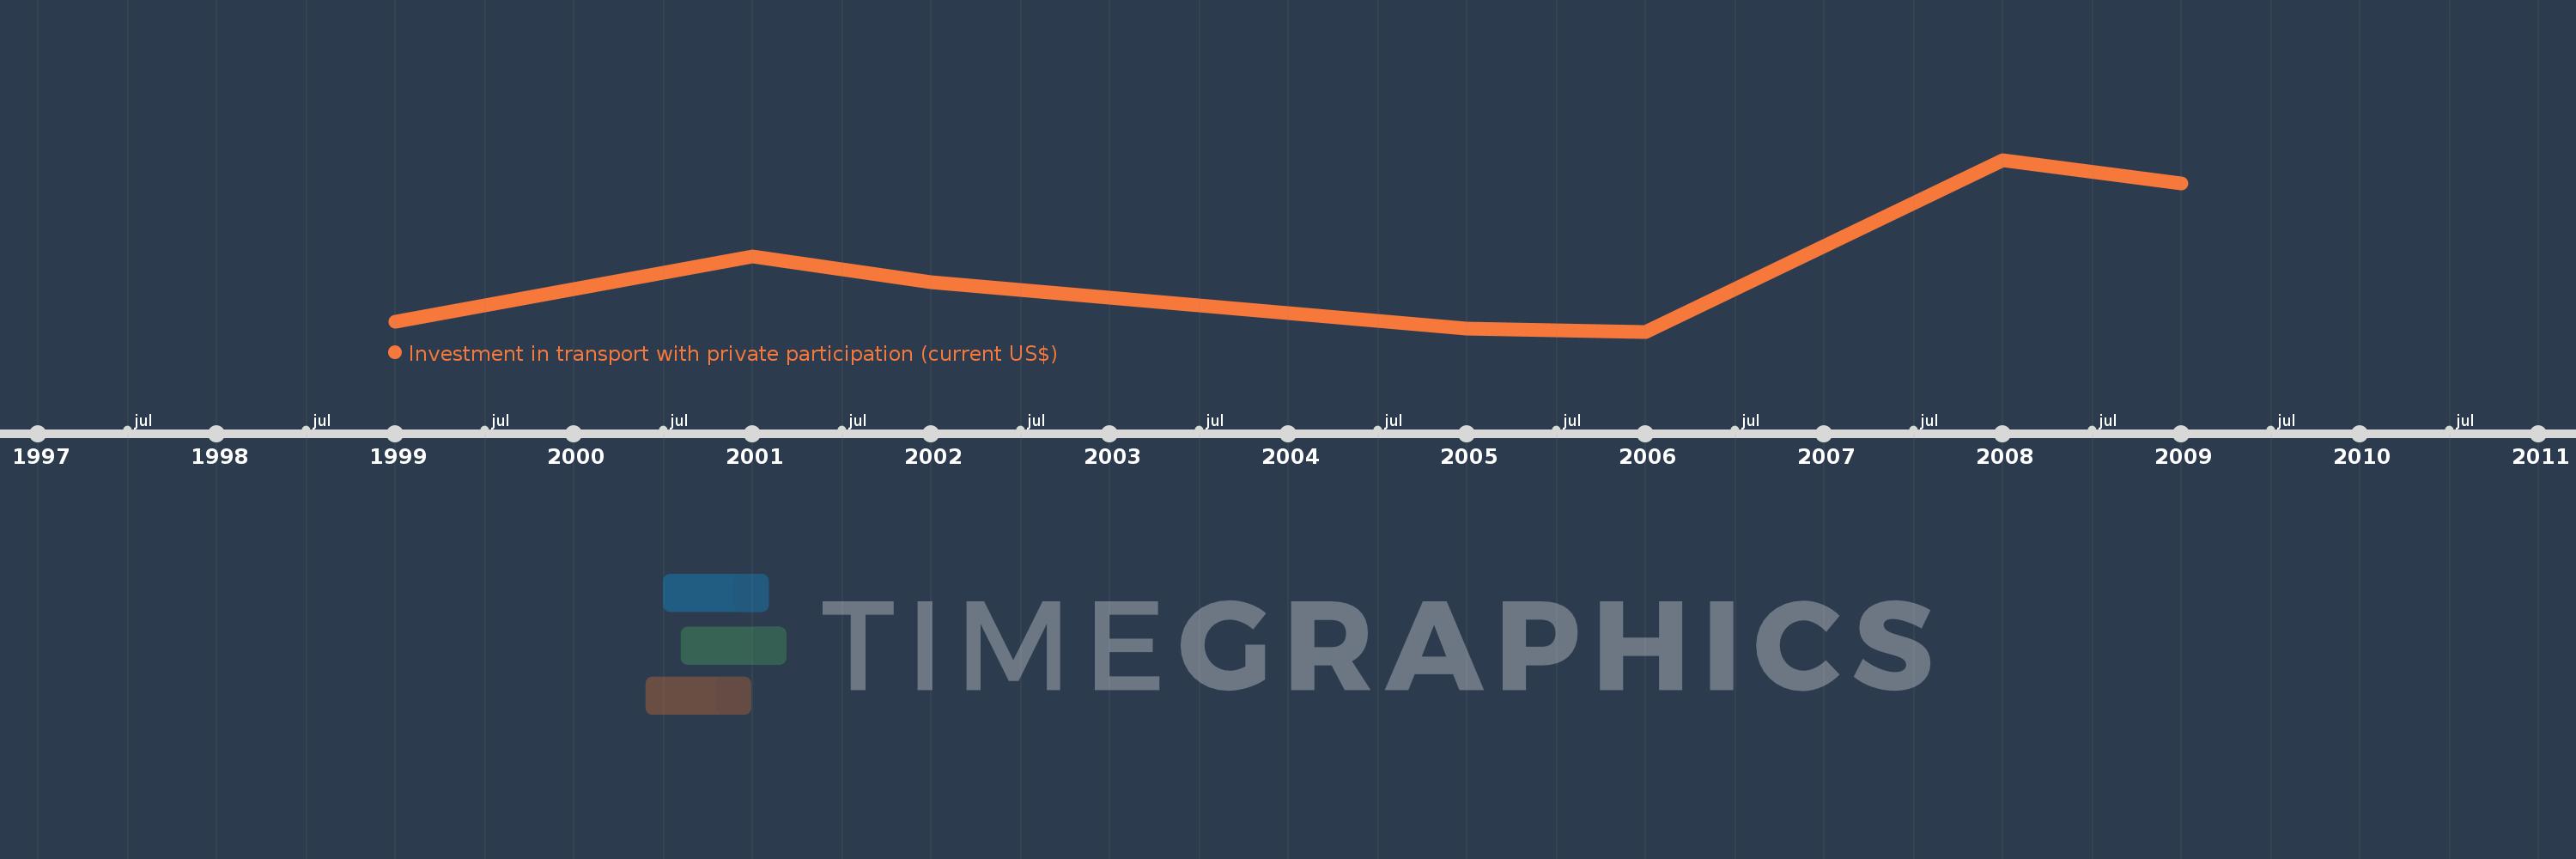
This timeline shows a graph from 1999 to 2009 of Egypt, Arab Rep.. No data until 1998. Number of actual observations by date: 7.
Source name:
World Development Indicators
Source organization:
World Bank, Private Participation in Infrastructure Project Database (http://ppi.worldbank.org).
Categories, topics:
Infrastructure, Private Sector
Last updated:
apr 23, 2017
Indicators value changes by year
Minimum:
86.2 mln
jan 1, 2006
Maximum:
730.0 mln
jan 1, 2008
At the date of observation
Value
Absolute change
Change from the previous value
jan 1, 1999
123.9 mln
+123.9 mln
0.0%
jan 1, 2001
368.3 mln
+244.4 mln
197.26%
jan 1, 2002
270.0 mln
-98.3 mln
-26.69%
jan 1, 2005
97.0 mln
-173.0 mln
-64.07%
jan 1, 2006
86.2 mln
-10.8 mln
-11.13%
jan 1, 2008
730.0 mln
+643.8 mln
746.87%
jan 1, 2009
640.0 mln
-90.0 mln
-12.33%
Ranking of countries by current statistics by years