33
/
AIzaSyB4mHJ5NPEv-XzF7P6NDYXjlkCWaeKw5bc
November 30, 2025
218540
Panama
PAN
true
2
1
Investment in transport with private participation (current US$)
2016,2014,2013,2010,2008,2001,1999,1998,1997,1996,1995
Create a timeline
Public Timelines
For education
For educational institutions
For teachers
For students
Cabinet
For educational institutions
For teachers
For students
Open cabinet
FAQ
Close
Create a timeline
Public timelines
FAQ
About & Feedback
Terms
Privacy
FAQ
Support 24/7
Cabinet
Get premium
Donate
Download
Global statistics library
→
Panama
→
Investment in transport with private participation (current US$)
This statistics in other country:
Albania
Algeria
Angola
Argentina
Armenia
Bangladesh
Belarus
Belize
Benin
Bolivia
Brazil
Bulgaria
Burkina Faso
Cambodia
Cameroon
Chile
China
Colombia
Comoros
Congo, Dem. Rep.
Congo, Rep.
Costa Rica
Cote d'Ivoire
Cuba
Djibouti
Dominican Republic
Early-demographic dividend
East Asia & Pacific (excluding high income)
East Asia & Pacific (IDA & IBRD countries)
Ecuador
Egypt, Arab Rep.
Gabon
Georgia
Ghana
Guatemala
Guinea
Haiti
Honduras
IBRD only
IDA & IBRD total
IDA blend
India
Indonesia
Iraq
Jamaica
Jordan
Kazakhstan
Kenya
Kosovo
Lao PDR
Late-demographic dividend
Latin America & Caribbean
Latin America & Caribbean (excluding high income)
Latin America & the Caribbean (IDA & IBRD countries)
Lebanon
Liberia
Low & middle income
Lower middle income
Macedonia, FYR
Madagascar
Malawi
Malaysia
Maldives
Mali
Mauritius
Mexico
Middle income
Moldova
Montenegro
Morocco
Mozambique
Myanmar
Nepal
Nicaragua
Nigeria
Pakistan
Panama
Paraguay
Peru
Philippines
Romania
Russian Federation
Senegal
Sierra Leone
Somalia
South Africa
South Asia
South Asia (IDA & IBRD)
Sri Lanka
Sudan
Syrian Arab Republic
Tanzania
Thailand
Togo
Tunisia
Turkey
Uganda
Ukraine
Upper middle income
Uruguay
Uzbekistan
Venezuela, RB
Vietnam
Yemen, Rep.
Zambia
Zimbabwe
Timeline:
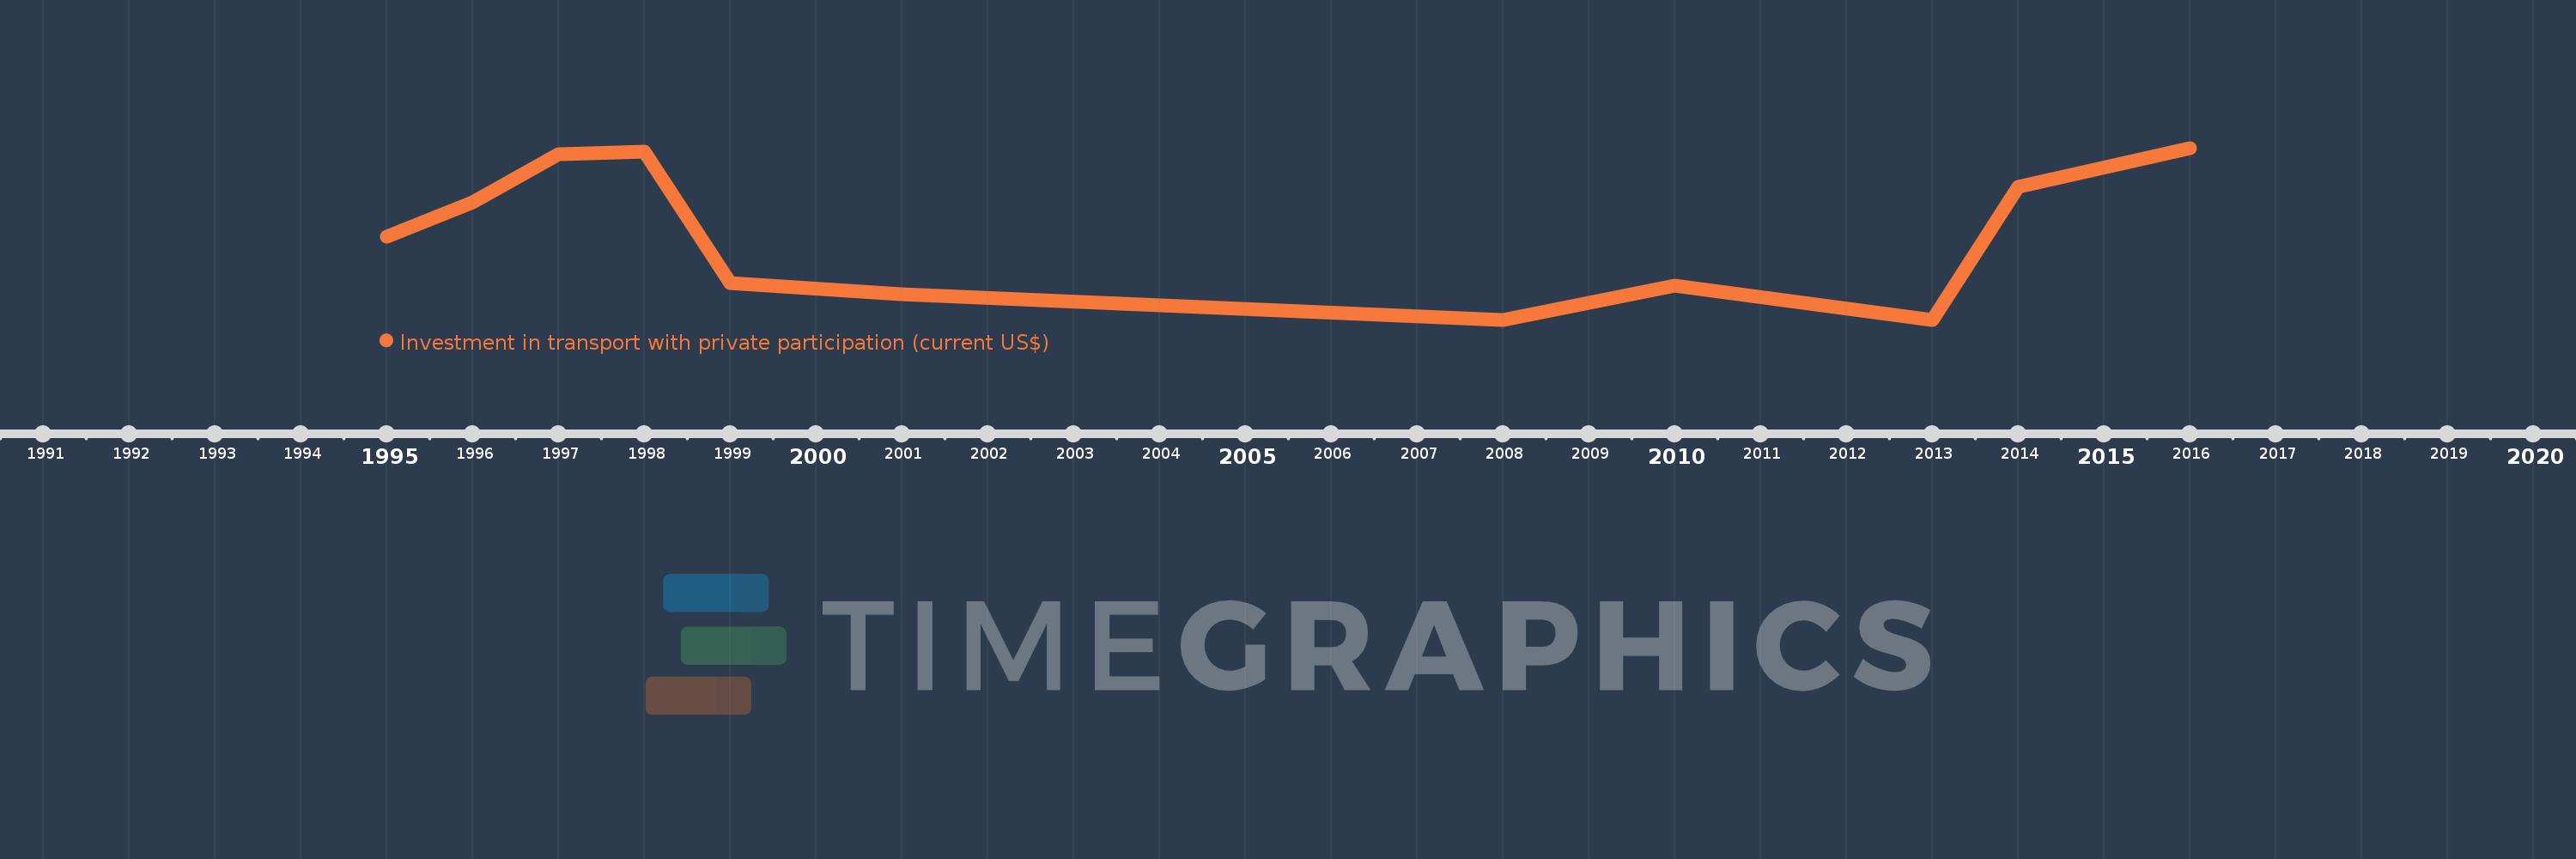
This timeline shows a graph from
1995
to
2016
of Panama. No data until
1994
. Number of actual observations by date:
11
.
Source name:
World Development Indicators
Source organization:
World Bank, Private Participation in Infrastructure Project Database (http://ppi.worldbank.org).
Categories, topics:
Infrastructure, Private Sector
Last updated:
apr 23, 2017
Indicators value changes by year
Meaning:
173.264 mln
Minimum:
0.0
jan 1, 2008
Maximum:
350.0 mln
jan 1, 2016
At the date of observation
Value
Absolute change
Change from the previous value
jan 1, 1995
169.9 mln
+169.9 mln
0.0%
jan 1, 1996
240.0 mln
+70.1 mln
41.26%
jan 1, 1997
337.0 mln
+97.0 mln
40.42%
jan 1, 1998
342.6 mln
+5.6 mln
1.66%
jan 1, 1999
75.0 mln
-267.6 mln
-78.11%
jan 1, 2001
51.4 mln
-23.6 mln
-31.47%
jan 1, 2008
0.0
-51.4 mln
-100.0%
jan 1, 2010
70.0 mln
+70.0 mln
%
jan 1, 2013
0.0
-70.0 mln
-100.0%
jan 1, 2014
270.0 mln
+270.0 mln
%
jan 1, 2016
350.0 mln
+80.0 mln
29.63%
Ranking of countries by current statistics by years
About & Feedback
Terms
Privacy
FAQ
Support 24/7
Cabinet
Get premium
Donate
The service accepts bank transfer (ACH, Wire) or cards (Visa, MasterCard, etc). Processed by Stripe.
Secured with SSL