Download This statistics in other country:
Timeline:
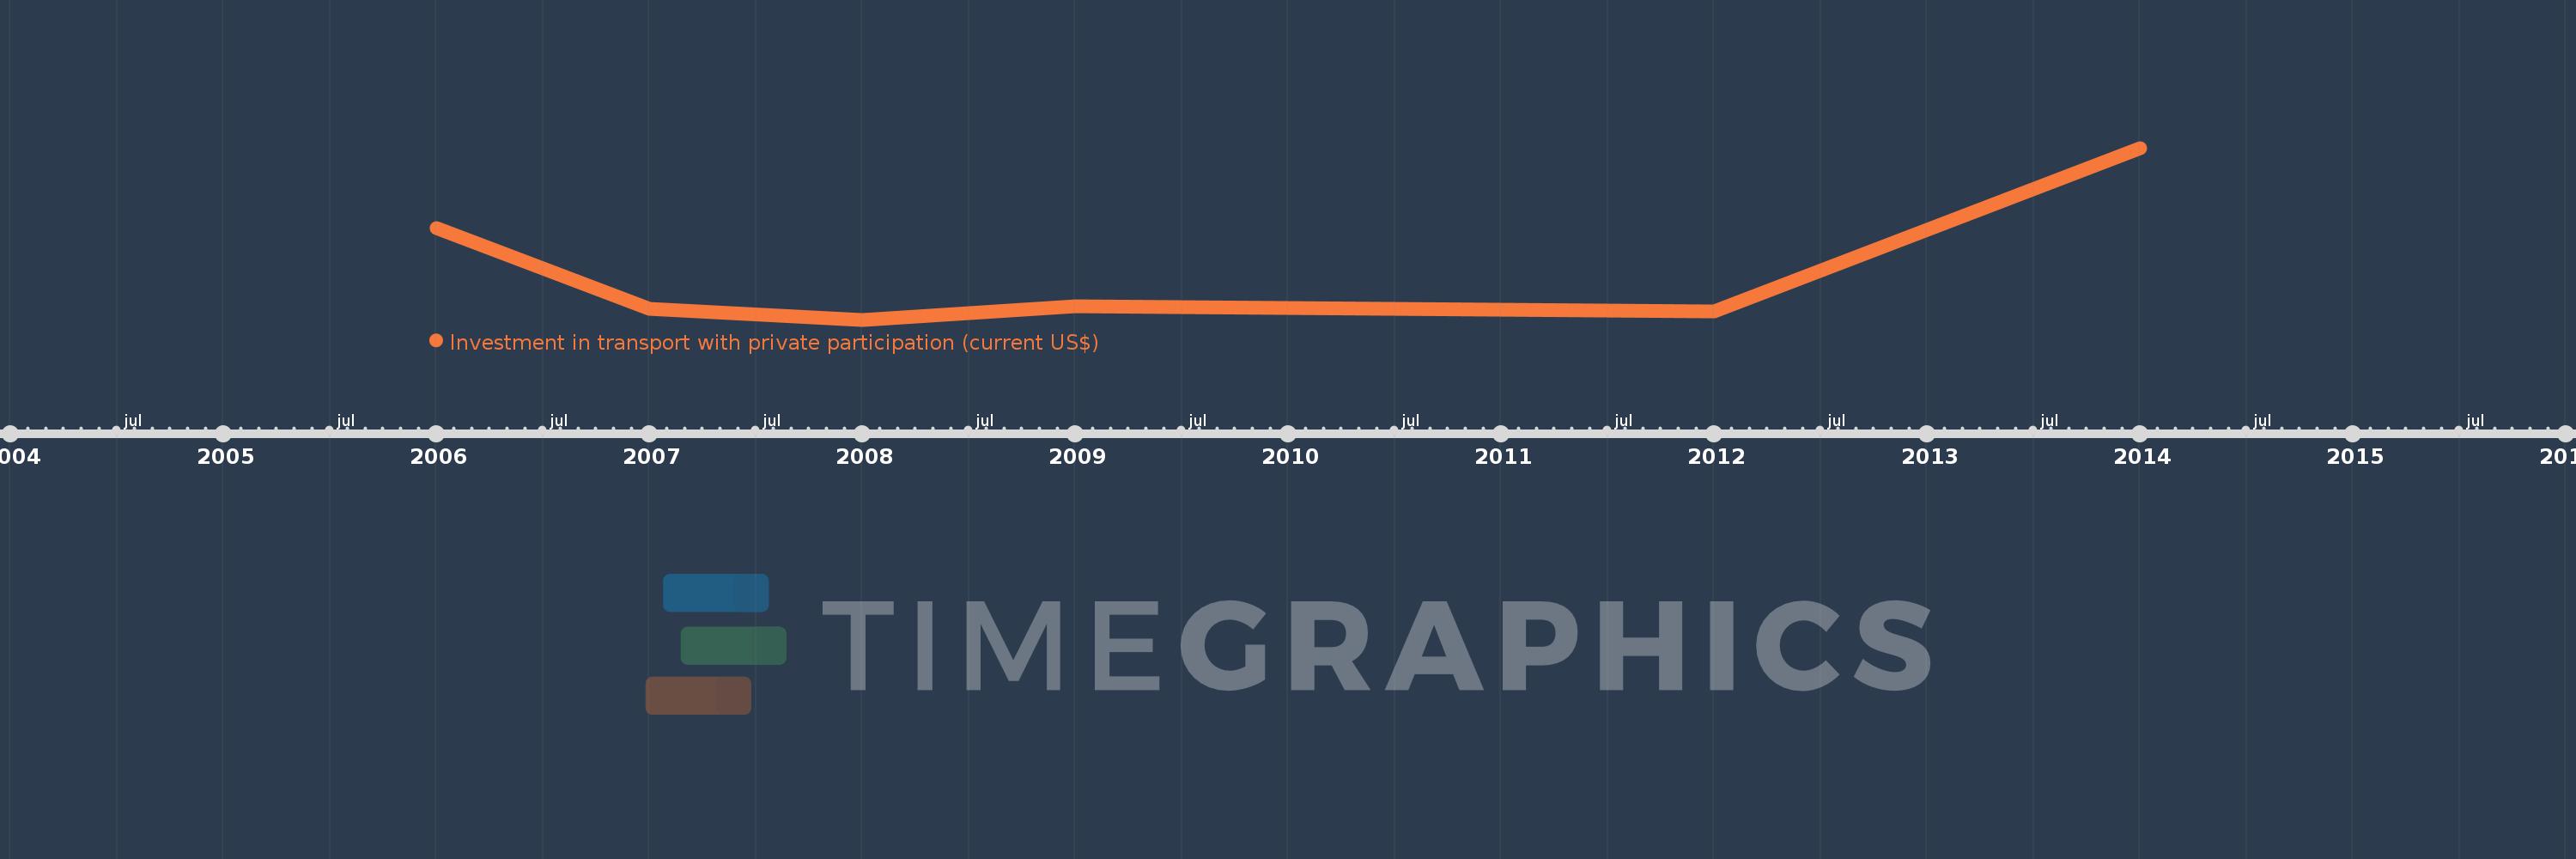
This timeline shows a graph from 2006 to 2014 of Nigeria. No data until 2005. Number of actual observations by date: 6.
Source name:
World Development Indicators
Source organization:
World Bank, Private Participation in Infrastructure Project Database (http://ppi.worldbank.org).
Categories, topics:
Infrastructure, Private Sector
Last updated:
apr 23, 2017
Indicators value changes by year
Minimum:
40.0 mln
jan 1, 2008
Maximum:
4.4 bln
jan 1, 2014
At the date of observation
Value
Absolute change
Change from the previous value
jan 1, 2006
2.355 bln
+2.355 bln
0.0%
jan 1, 2007
322.14 mln
-2.033 bln
-86.32%
jan 1, 2008
40.0 mln
-282.14 mln
-87.58%
jan 1, 2009
382.0 mln
+342.0 mln
855.0%
jan 1, 2012
259.4 mln
-122.6 mln
-32.09%
jan 1, 2014
4.4 bln
+4.141 bln
1.6K%
Ranking of countries by current statistics by years