Download This statistics in other country:
Timeline:
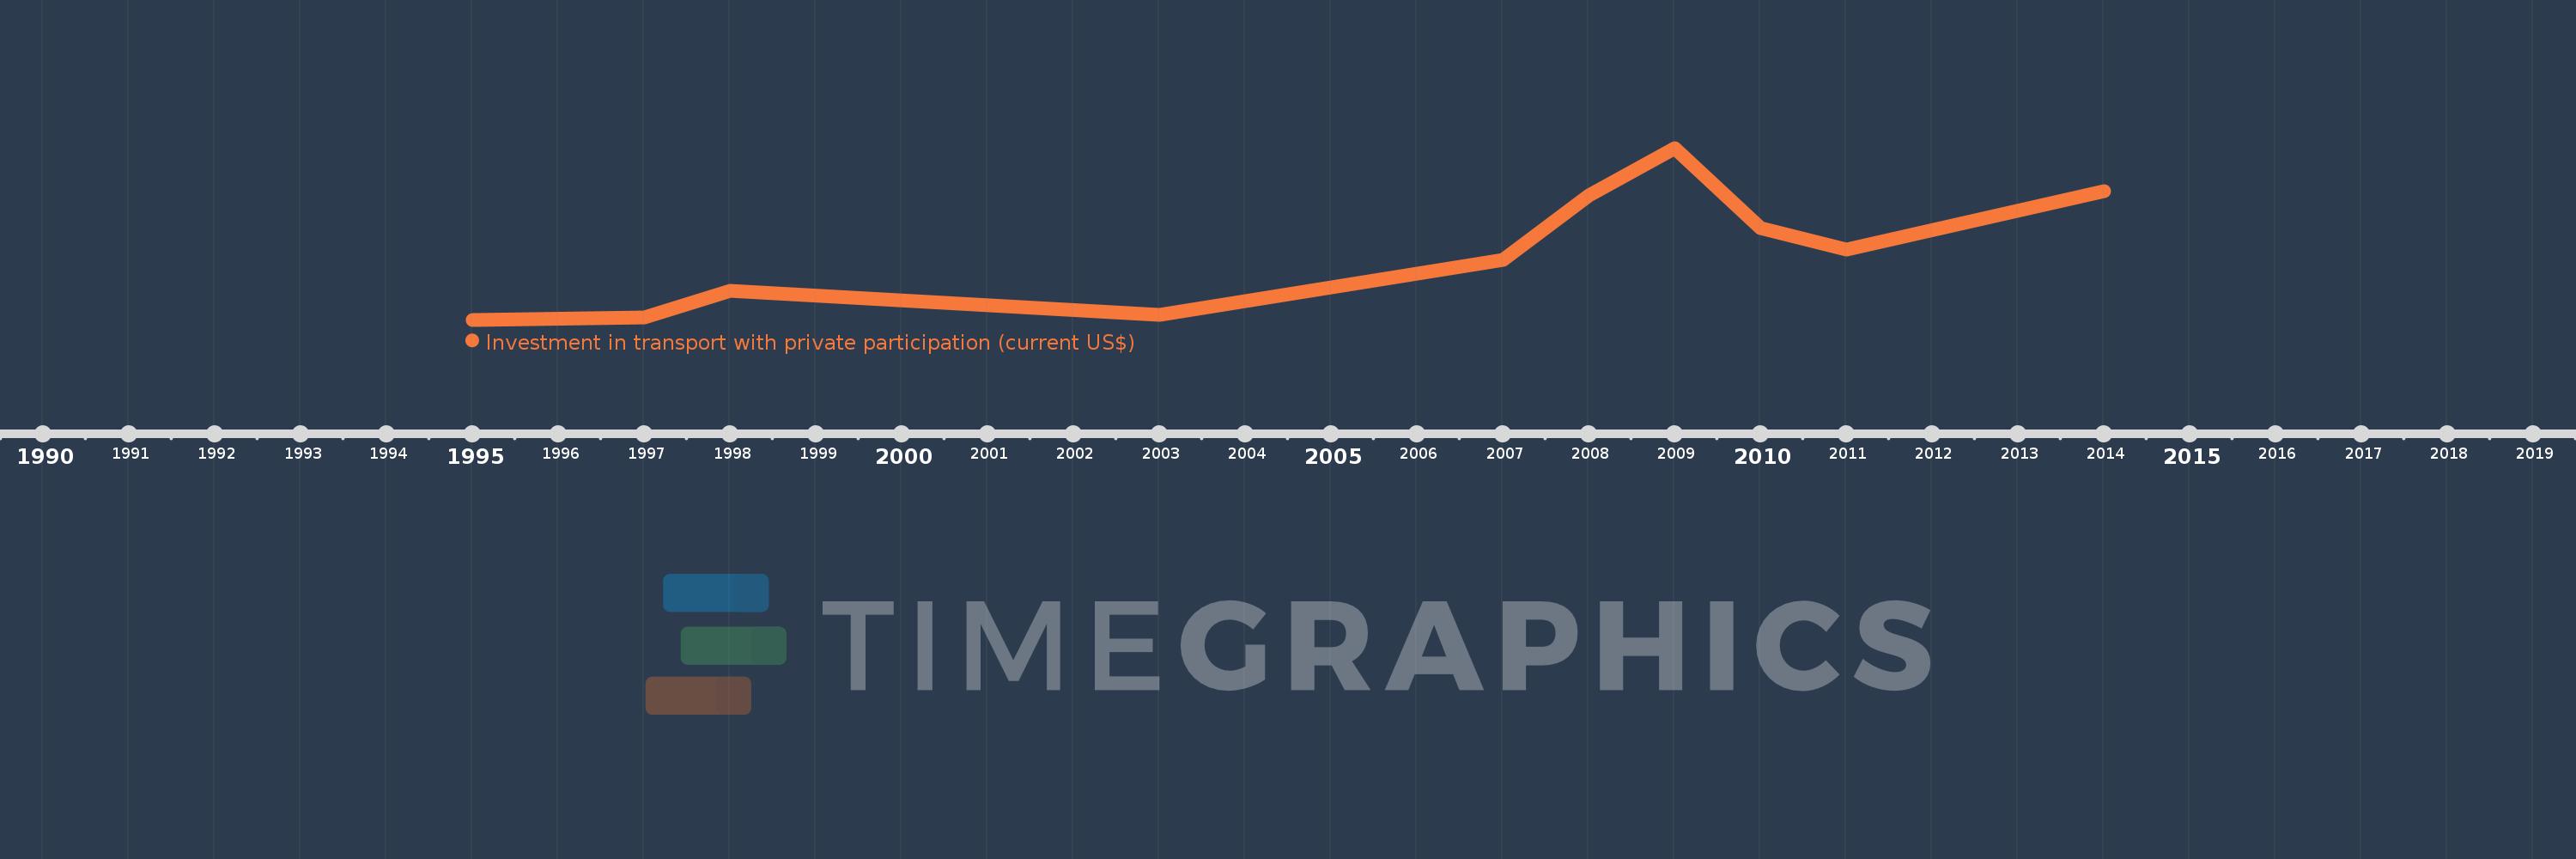
This timeline shows a graph from 1995 to 2014 of Vietnam. No data until 1994. Number of actual observations by date: 10.
Source name:
World Development Indicators
Source organization:
World Bank, Private Participation in Infrastructure Project Database (http://ppi.worldbank.org).
Categories, topics:
Infrastructure, Private Sector
Last updated:
apr 23, 2017
Indicators value changes by year
Minimum:
10.0 mln
jan 1, 1995
Maximum:
365.0 mln
jan 1, 2009
At the date of observation
Value
Absolute change
Change from the previous value
jan 1, 1995
10.0 mln
+10.0 mln
0.0%
jan 1, 1997
15.0 mln
+5.0 mln
50.0%
jan 1, 1998
70.0 mln
+55.0 mln
366.67%
jan 1, 2003
20.0 mln
-50.0 mln
-71.43%
jan 1, 2007
133.0 mln
+113.0 mln
565.0%
jan 1, 2008
267.0 mln
+134.0 mln
100.75%
jan 1, 2009
365.0 mln
+98.0 mln
36.7%
jan 1, 2010
200.0 mln
-165.0 mln
-45.21%
jan 1, 2011
155.0 mln
-45.0 mln
-22.5%
jan 1, 2014
275.5 mln
+120.5 mln
77.74%
Ranking of countries by current statistics by years