Download This statistics in other country:
Timeline:
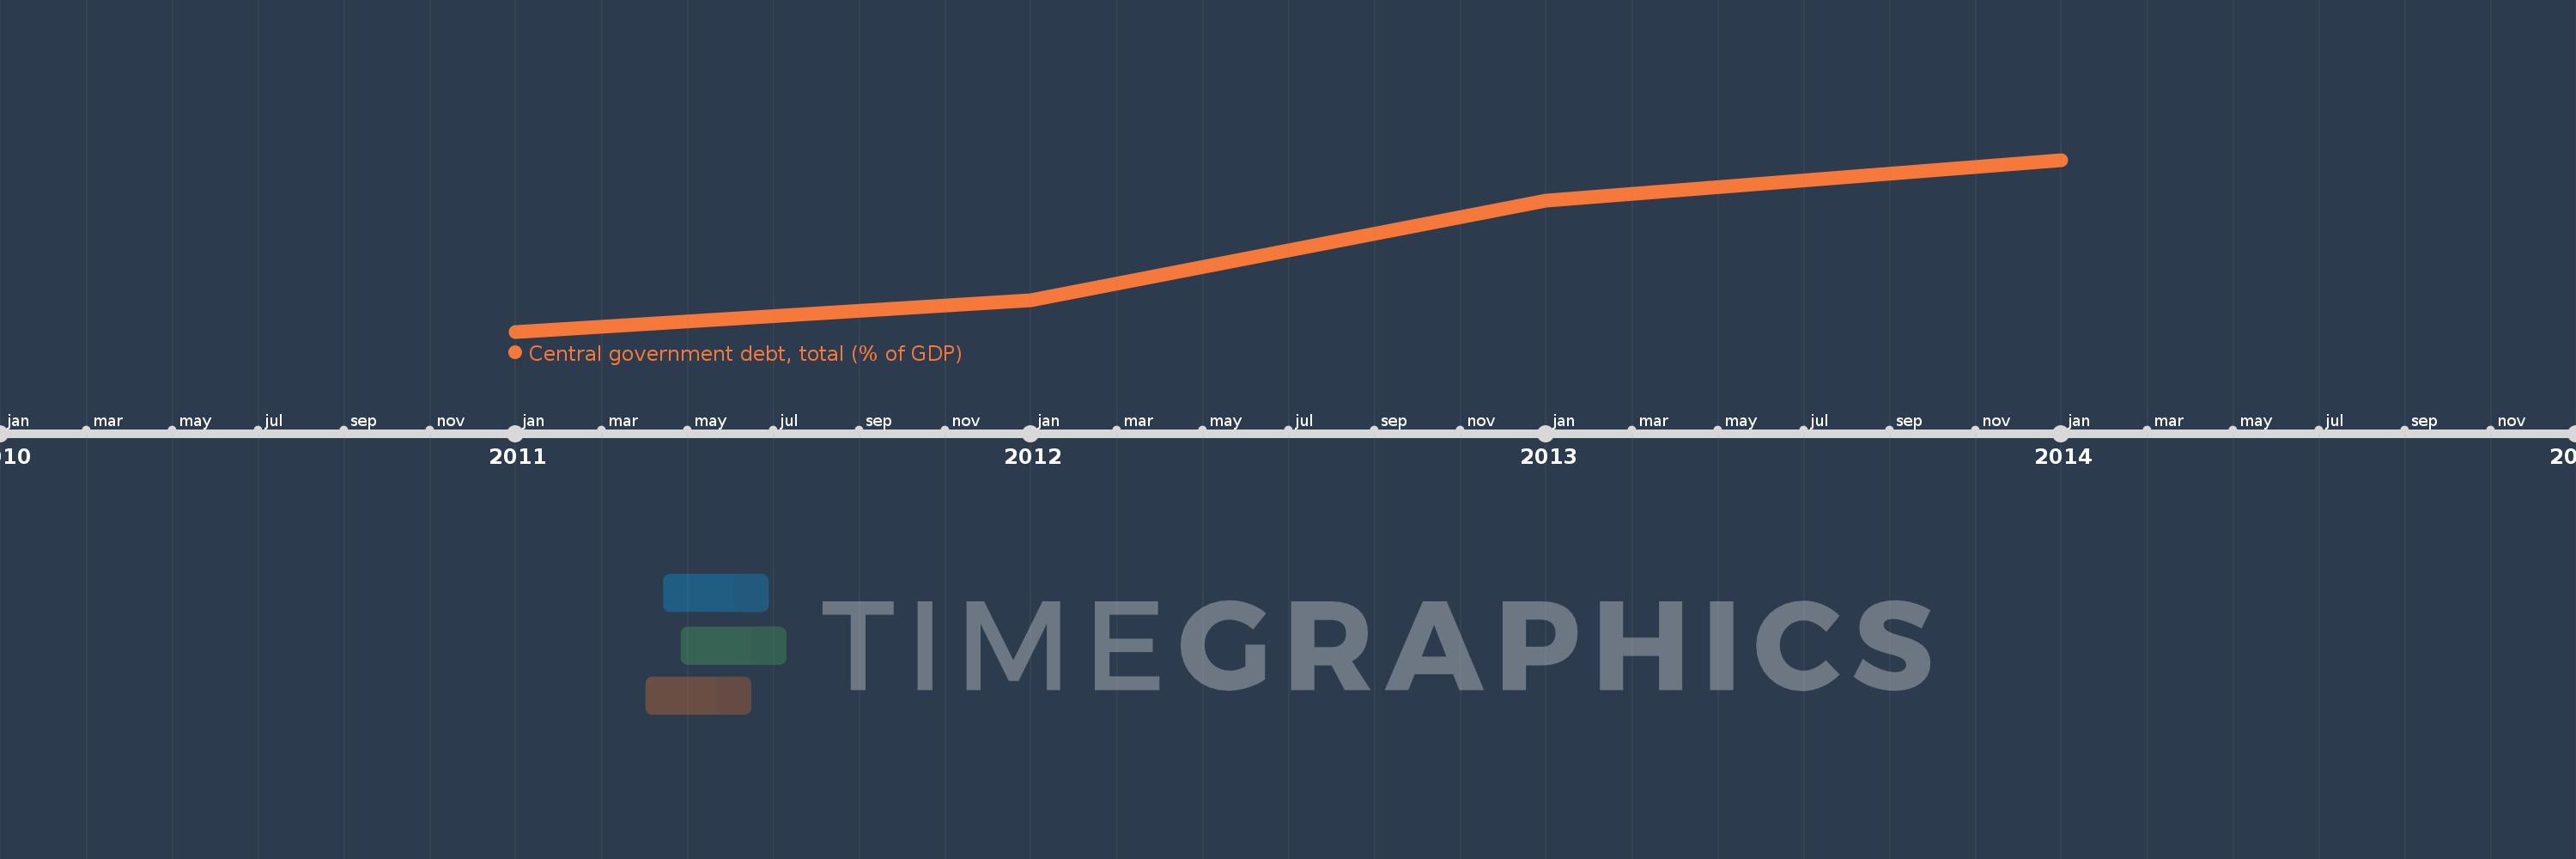
This timeline shows a graph from 2011 to 2014 of European Union. No data until 2010. Number of actual observations by date: 4.
Source name:
World Development Indicators
Source organization:
International Monetary Fund, Government Finance Statistics Yearbook and data files, and World Bank and OECD GDP estimates.
Categories, topics:
Economy & Growth, Public Sector
Last updated:
apr 23, 2017
Indicators value changes by year
Minimum:
69.913
jan 1, 2011
Maximum:
85.473
jan 1, 2014
At the date of observation
Value
Absolute change
Change from the previous value
jan 1, 2011
69.913
+69.913
0.0%
jan 1, 2012
72.739
+2.826
4.04%
jan 1, 2013
81.751
+9.012
12.39%
jan 1, 2014
85.473
+3.722
4.55%
Ranking of countries by current statistics by years