Download This statistics in other country:
Timeline:
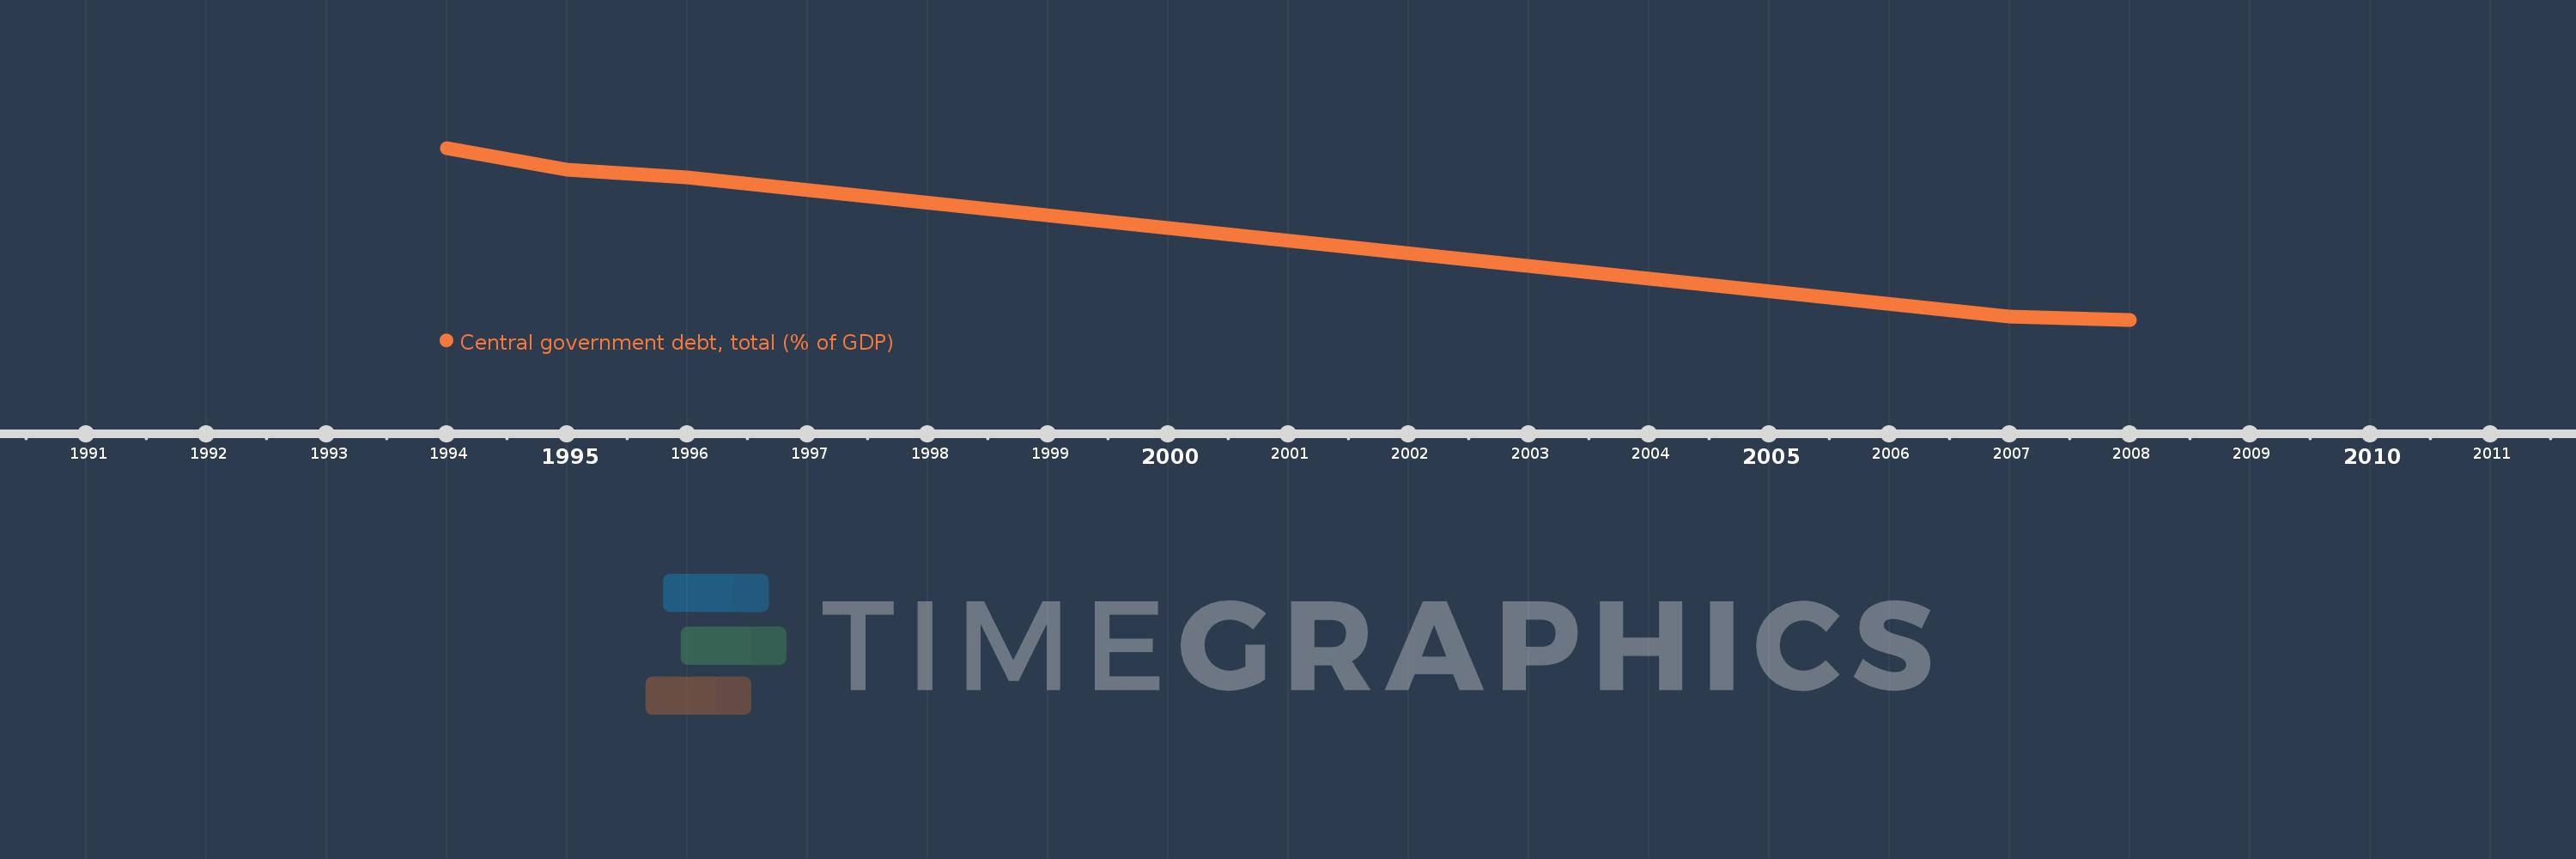
This timeline shows a graph from 1994 to 2008 of Trinidad and Tobago. No data until 1993. Number of actual observations by date: 5.
Source name:
World Development Indicators
Source organization:
International Monetary Fund, Government Finance Statistics Yearbook and data files, and World Bank and OECD GDP estimates.
Categories, topics:
Economy & Growth, Public Sector
Last updated:
apr 23, 2017
Indicators value changes by year
Minimum:
15.928
jan 1, 2008
Maximum:
58.886
jan 1, 1994
At the date of observation
Value
Absolute change
Change from the previous value
jan 1, 1994
58.886
+58.886
0.0%
jan 1, 1995
53.438
-5.448
-9.25%
jan 1, 1996
51.512
-1.926
-3.6%
jan 1, 2007
16.803
-34.709
-67.38%
jan 1, 2008
15.928
-0.875
-5.21%
Ranking of countries by current statistics by years