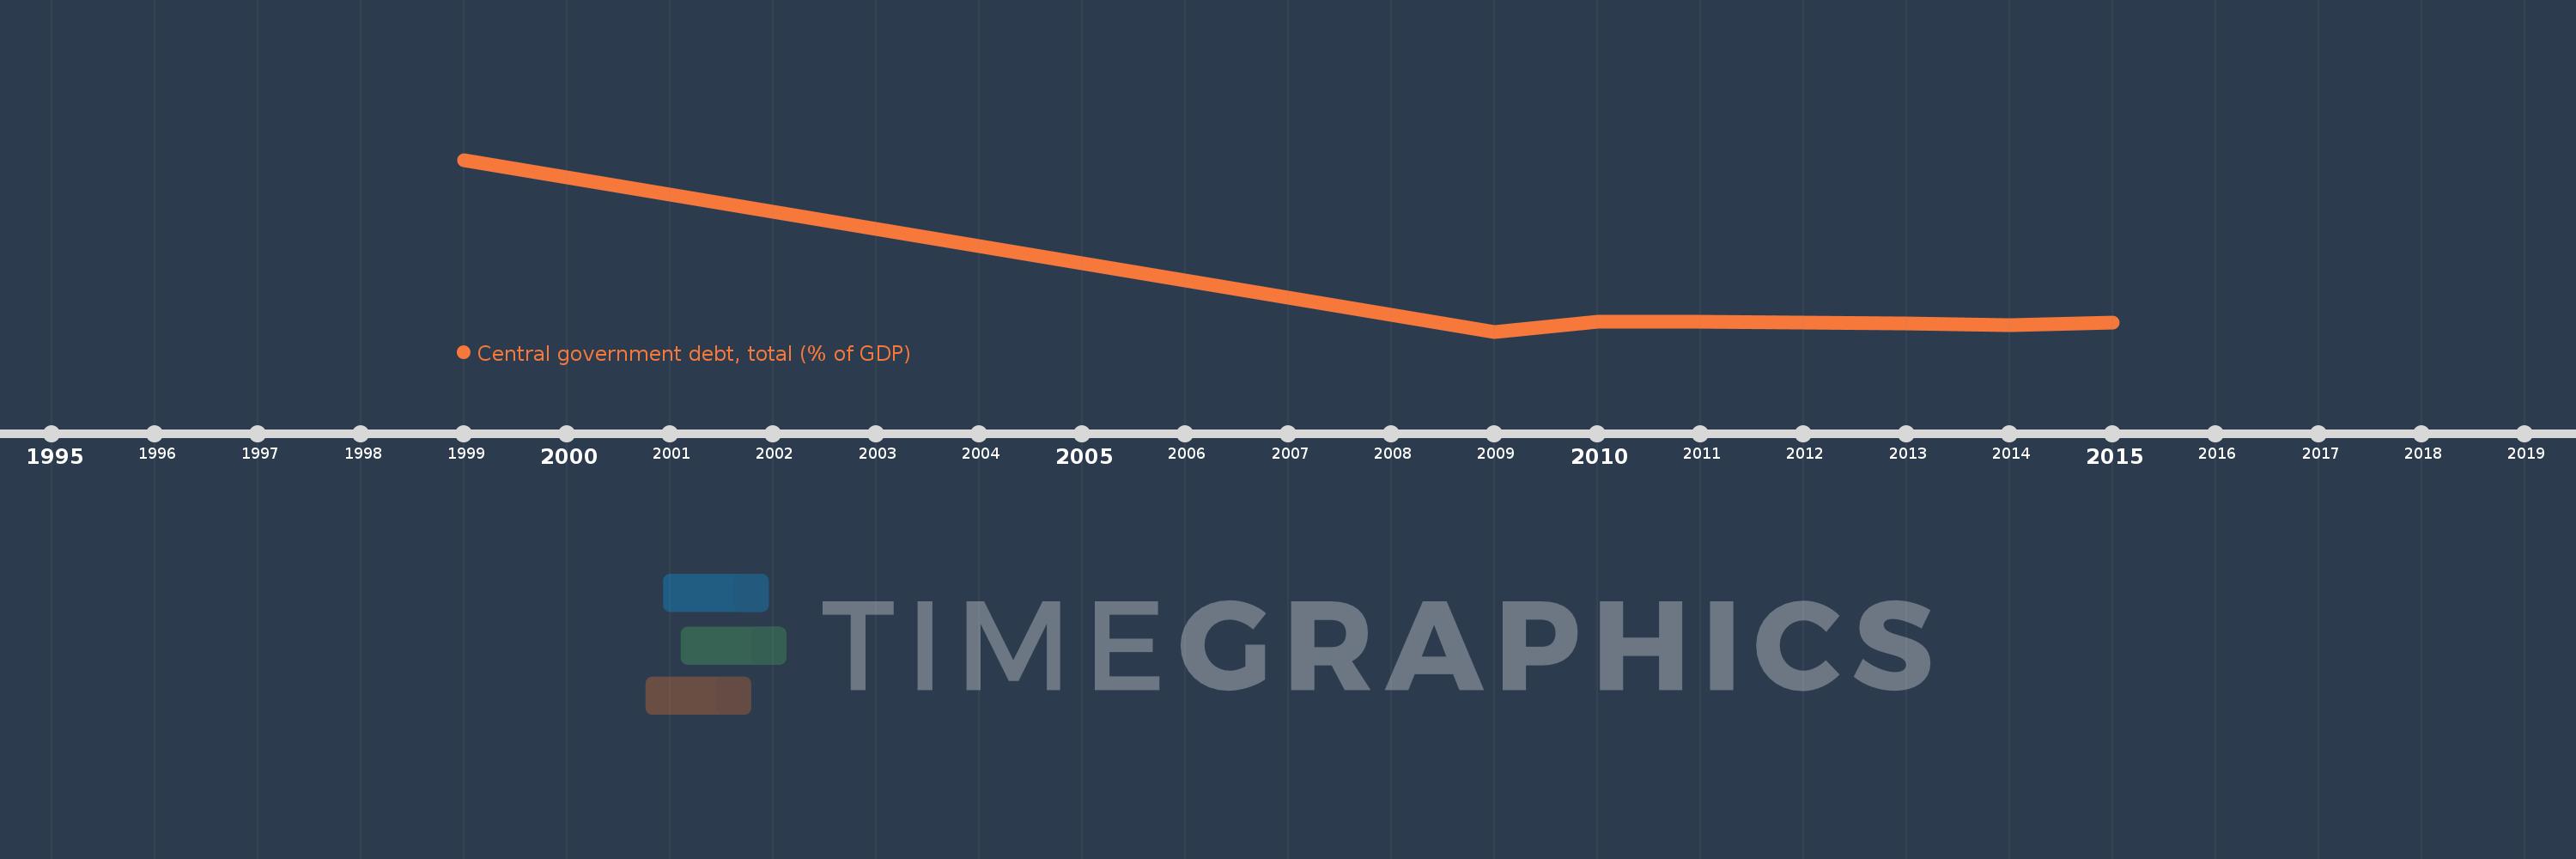
This timeline shows a graph from 1999 to 2015 of Europe & Central Asia (excluding high income). No data until 1998. Number of actual observations by date: 8.
Source name:
World Development Indicators
Source organization:
International Monetary Fund, Government Finance Statistics Yearbook and data files, and World Bank and OECD GDP estimates.
Categories, topics:
Economy & Growth, Public Sector
Last updated:
apr 23, 2017
Indicators value changes by year
Meaning:
32.008
Minimum:
18.169
jan 1, 2009
Maximum:
103.272
jan 1, 1999
At the date of observation
Value
Absolute change
Change from the previous value
jan 1, 1999
103.272
+103.272
0.0%
jan 1, 2009
18.169
-85.103
-82.41%
jan 1, 2010
23.021
+4.853
26.71%
jan 1, 2011
22.906
-0.116
-0.5%
jan 1, 2012
22.477
-0.429
-1.87%
jan 1, 2013
22.263
-0.214
-0.95%
jan 1, 2014
21.461
-0.802
-3.6%
jan 1, 2015
22.499
+1.038
4.83%
Ranking of countries by current statistics by years