Download This statistics in other country:
Timeline:
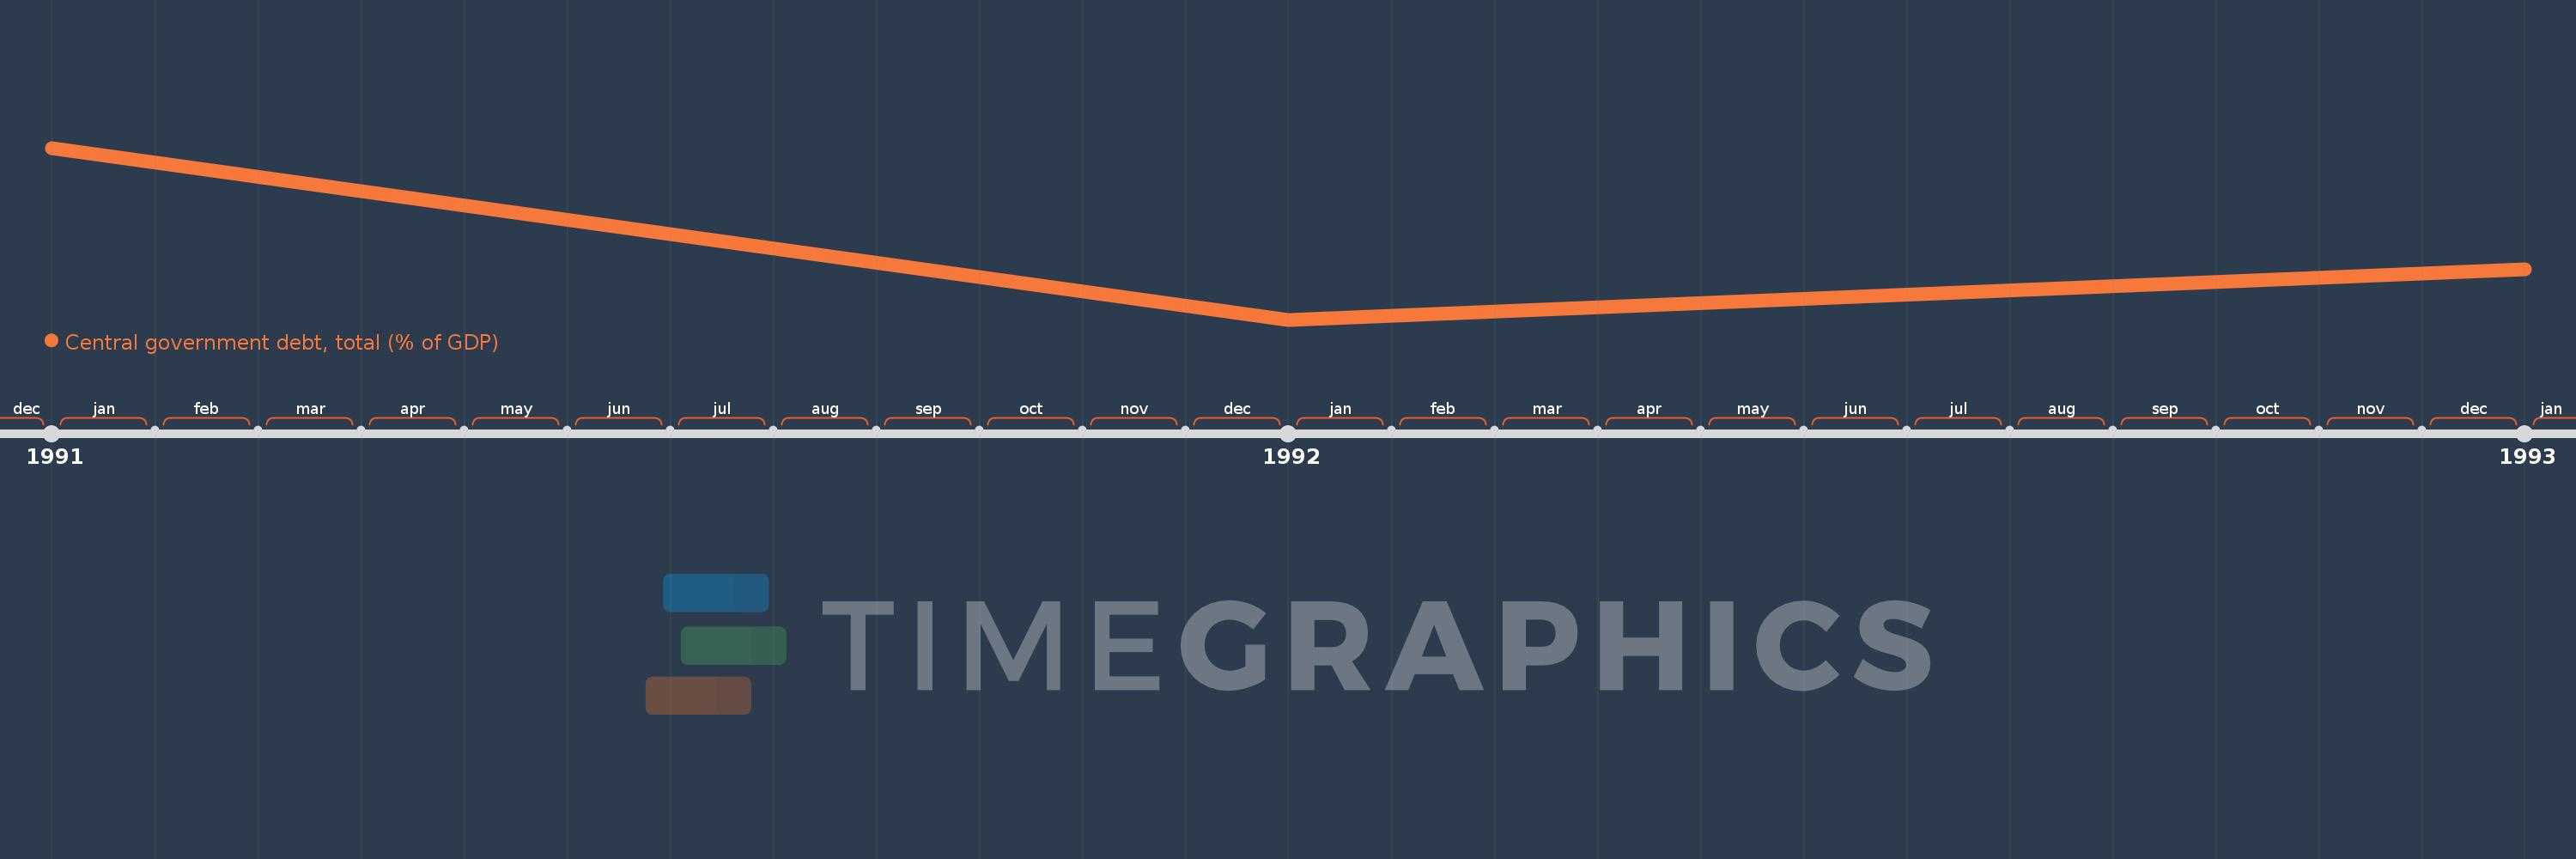
This timeline shows a graph from 1991 to 1993 of Rwanda. No data until 1990. Number of actual observations by date: 3.
Source name:
World Development Indicators
Source organization:
International Monetary Fund, Government Finance Statistics Yearbook and data files, and World Bank and OECD GDP estimates.
Categories, topics:
Economy & Growth, Public Sector
Last updated:
apr 23, 2017
Indicators value changes by year
Maximum:
49.797
jan 1, 1991
At the date of observation
Value
Absolute change
Change from the previous value
jan 1, 1991
49.797
+49.797
0.0%
jan 1, 1992
47.86
-1.937
-3.89%
jan 1, 1993
48.429
+0.569
1.19%
Ranking of countries by current statistics by years