Download This statistics in other country:
Timeline:
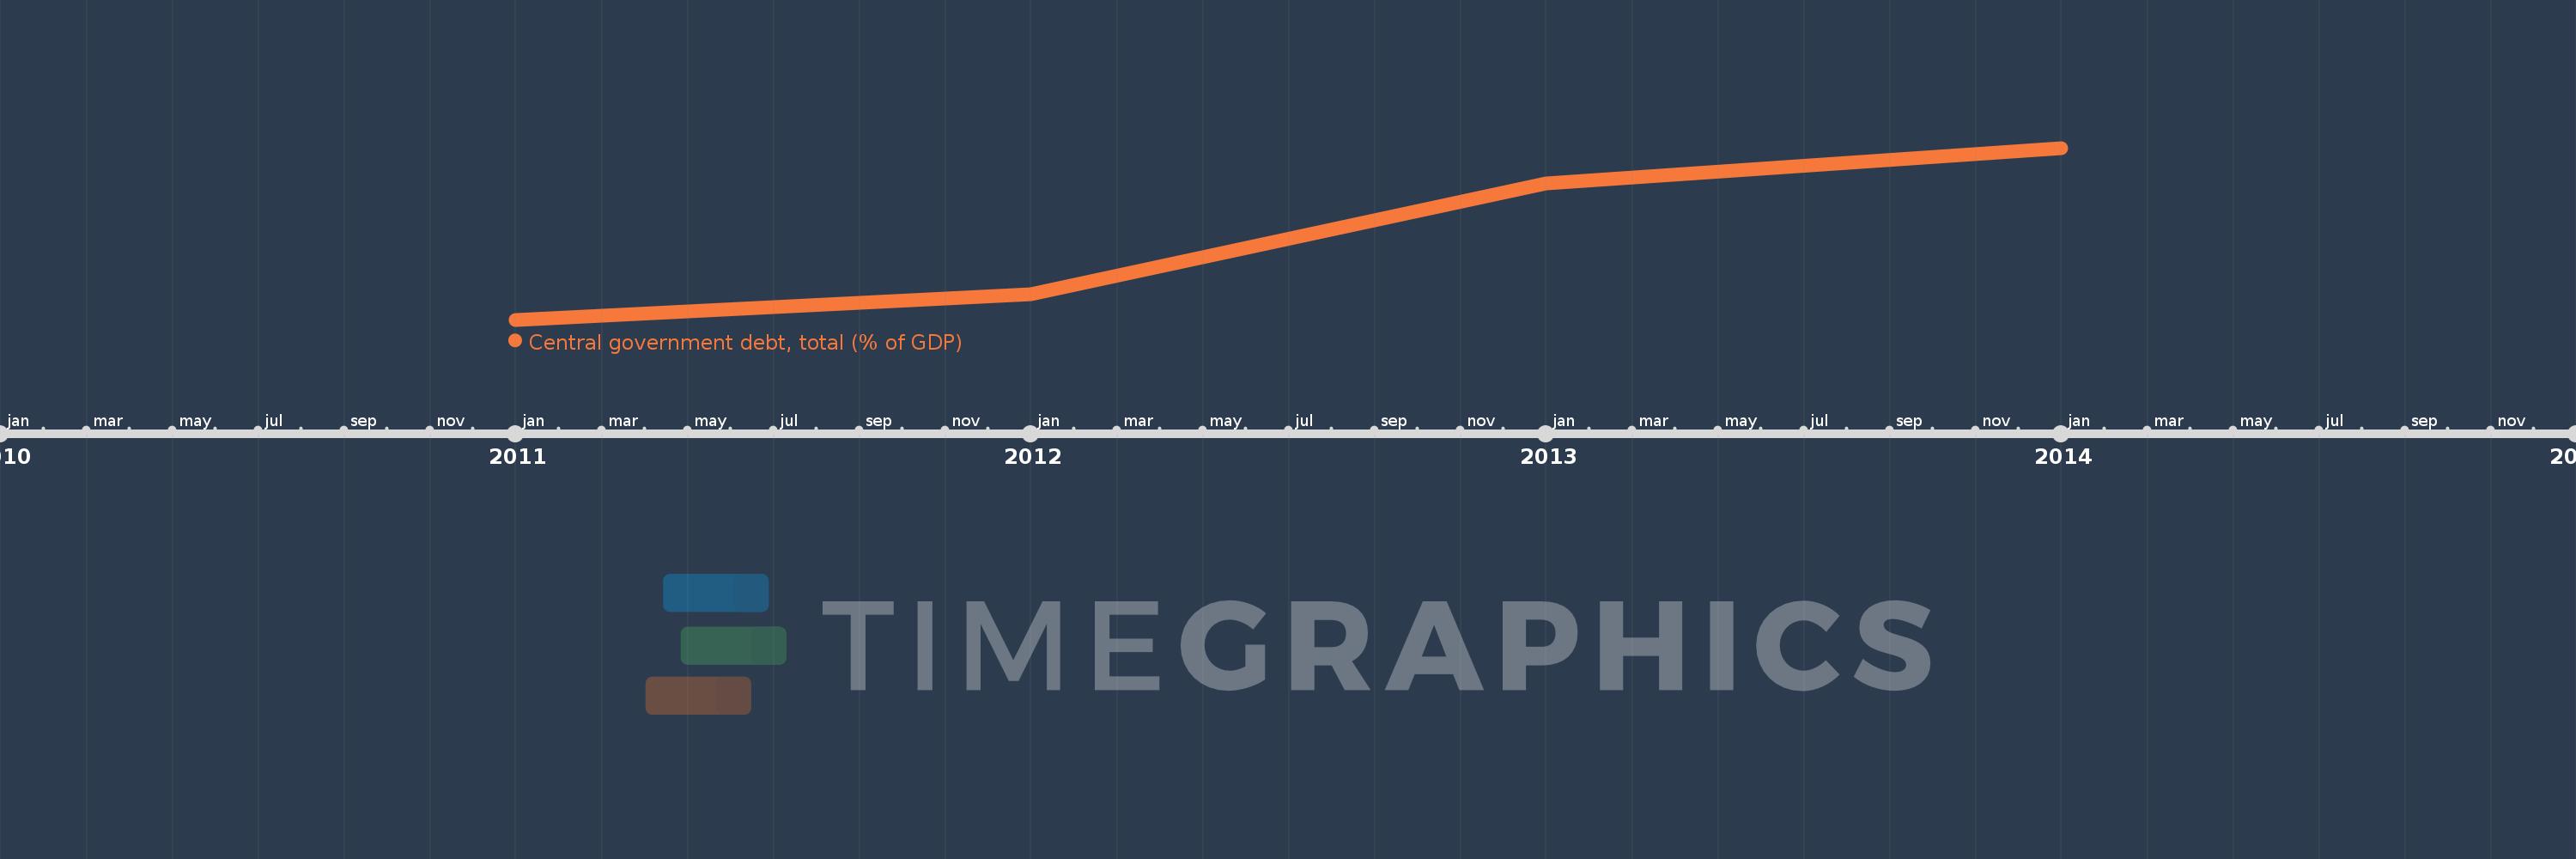
This timeline shows a graph from 2011 to 2014 of Europe & Central Asia. No data until 2010. Number of actual observations by date: 4.
Source name:
World Development Indicators
Source organization:
International Monetary Fund, Government Finance Statistics Yearbook and data files, and World Bank and OECD GDP estimates.
Categories, topics:
Economy & Growth, Public Sector
Last updated:
apr 23, 2017
Indicators value changes by year
Minimum:
62.272
jan 1, 2011
Maximum:
75.967
jan 1, 2014
At the date of observation
Value
Absolute change
Change from the previous value
jan 1, 2011
62.272
+62.272
0.0%
jan 1, 2012
64.309
+2.037
3.27%
jan 1, 2013
73.166
+8.857
13.77%
jan 1, 2014
75.967
+2.801
3.83%
Ranking of countries by current statistics by years