Download This statistics in other country:
Timeline:
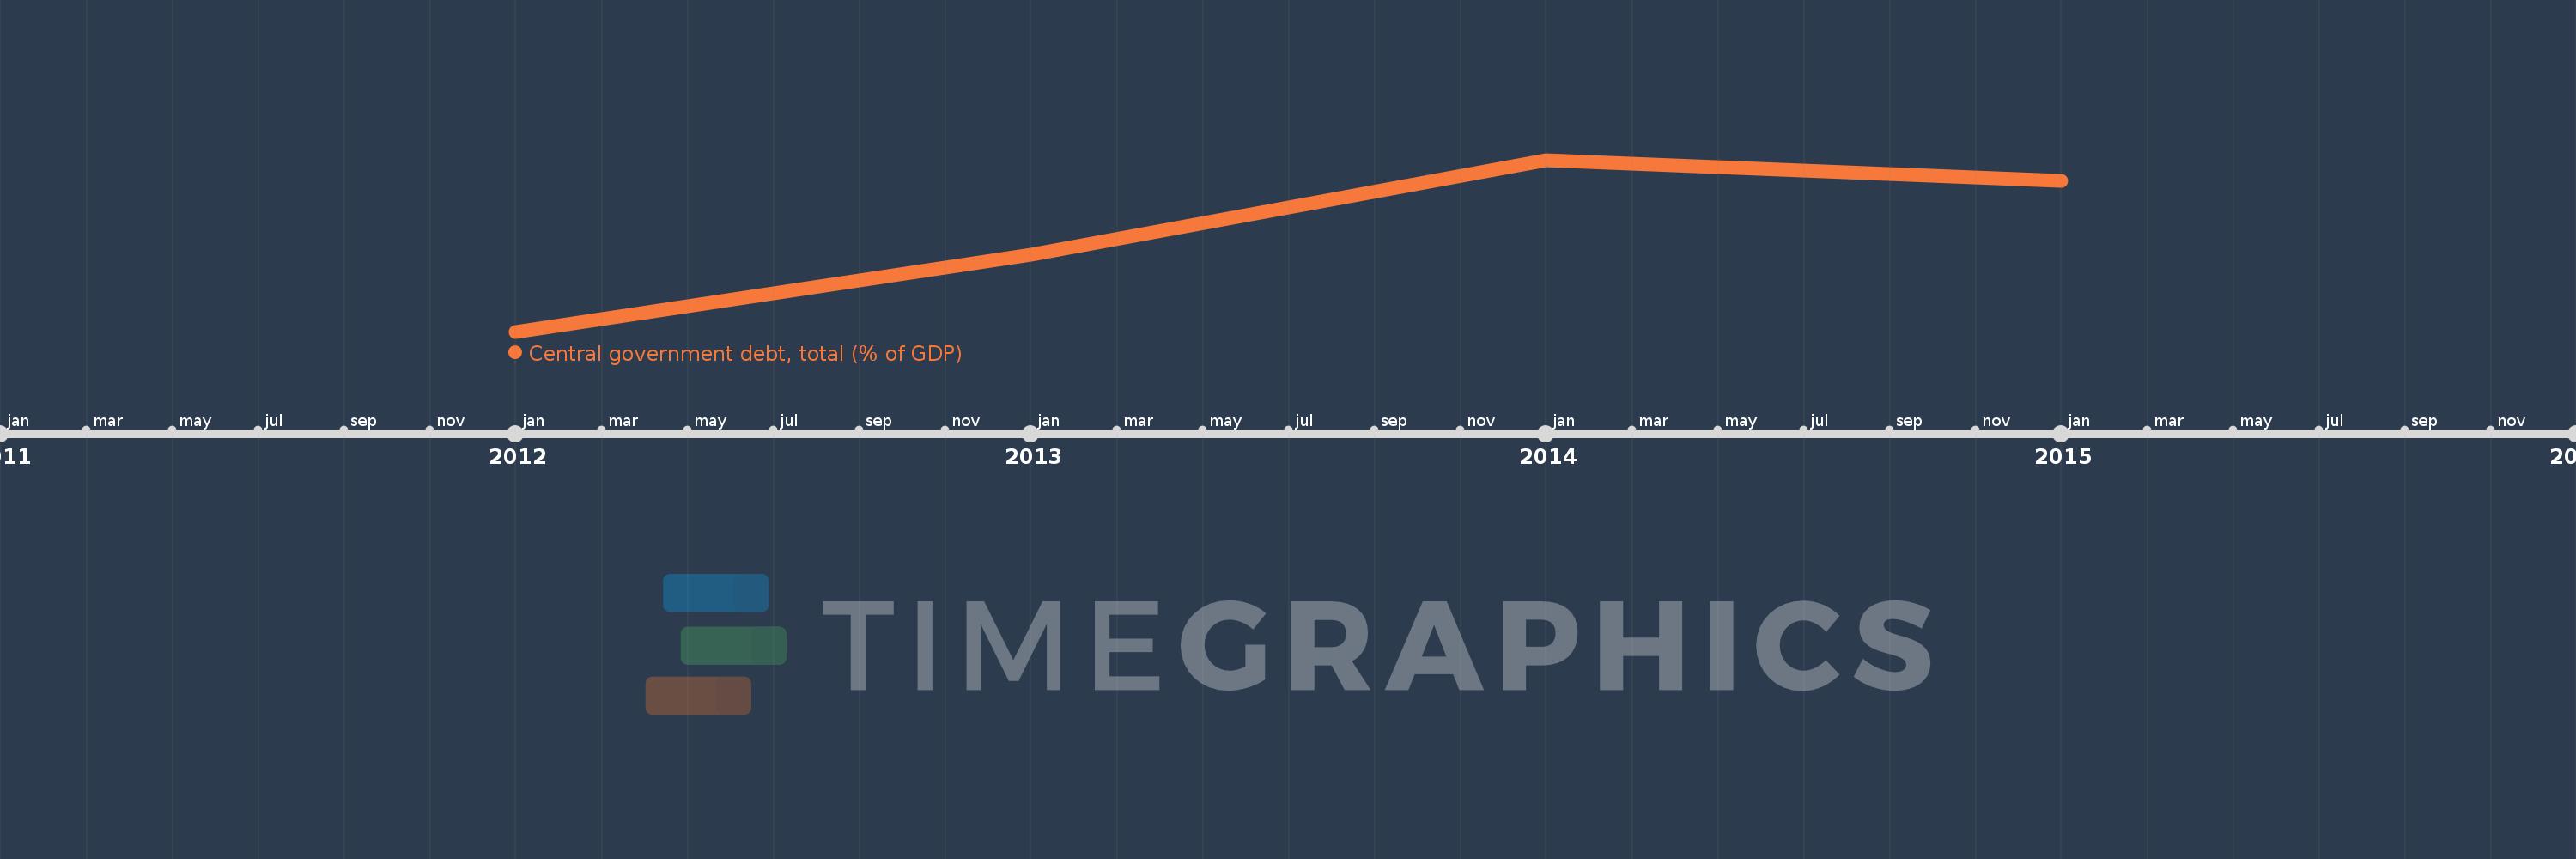
This timeline shows a graph from 2012 to 2015 of Samoa. No data until 2011. Number of actual observations by date: 4.
Source name:
World Development Indicators
Source organization:
International Monetary Fund, Government Finance Statistics Yearbook and data files, and World Bank and OECD GDP estimates.
Categories, topics:
Economy & Growth, Public Sector
Last updated:
apr 23, 2017
Indicators value changes by year
Minimum:
49.119
jan 1, 2012
Maximum:
55.689
jan 1, 2014
At the date of observation
Value
Absolute change
Change from the previous value
jan 1, 2012
49.119
+49.119
0.0%
jan 1, 2013
52.059
+2.94
5.99%
jan 1, 2014
55.689
+3.63
6.97%
jan 1, 2015
54.869
-0.821
-1.47%
Ranking of countries by current statistics by years