Download This statistics in other country:
Timeline:
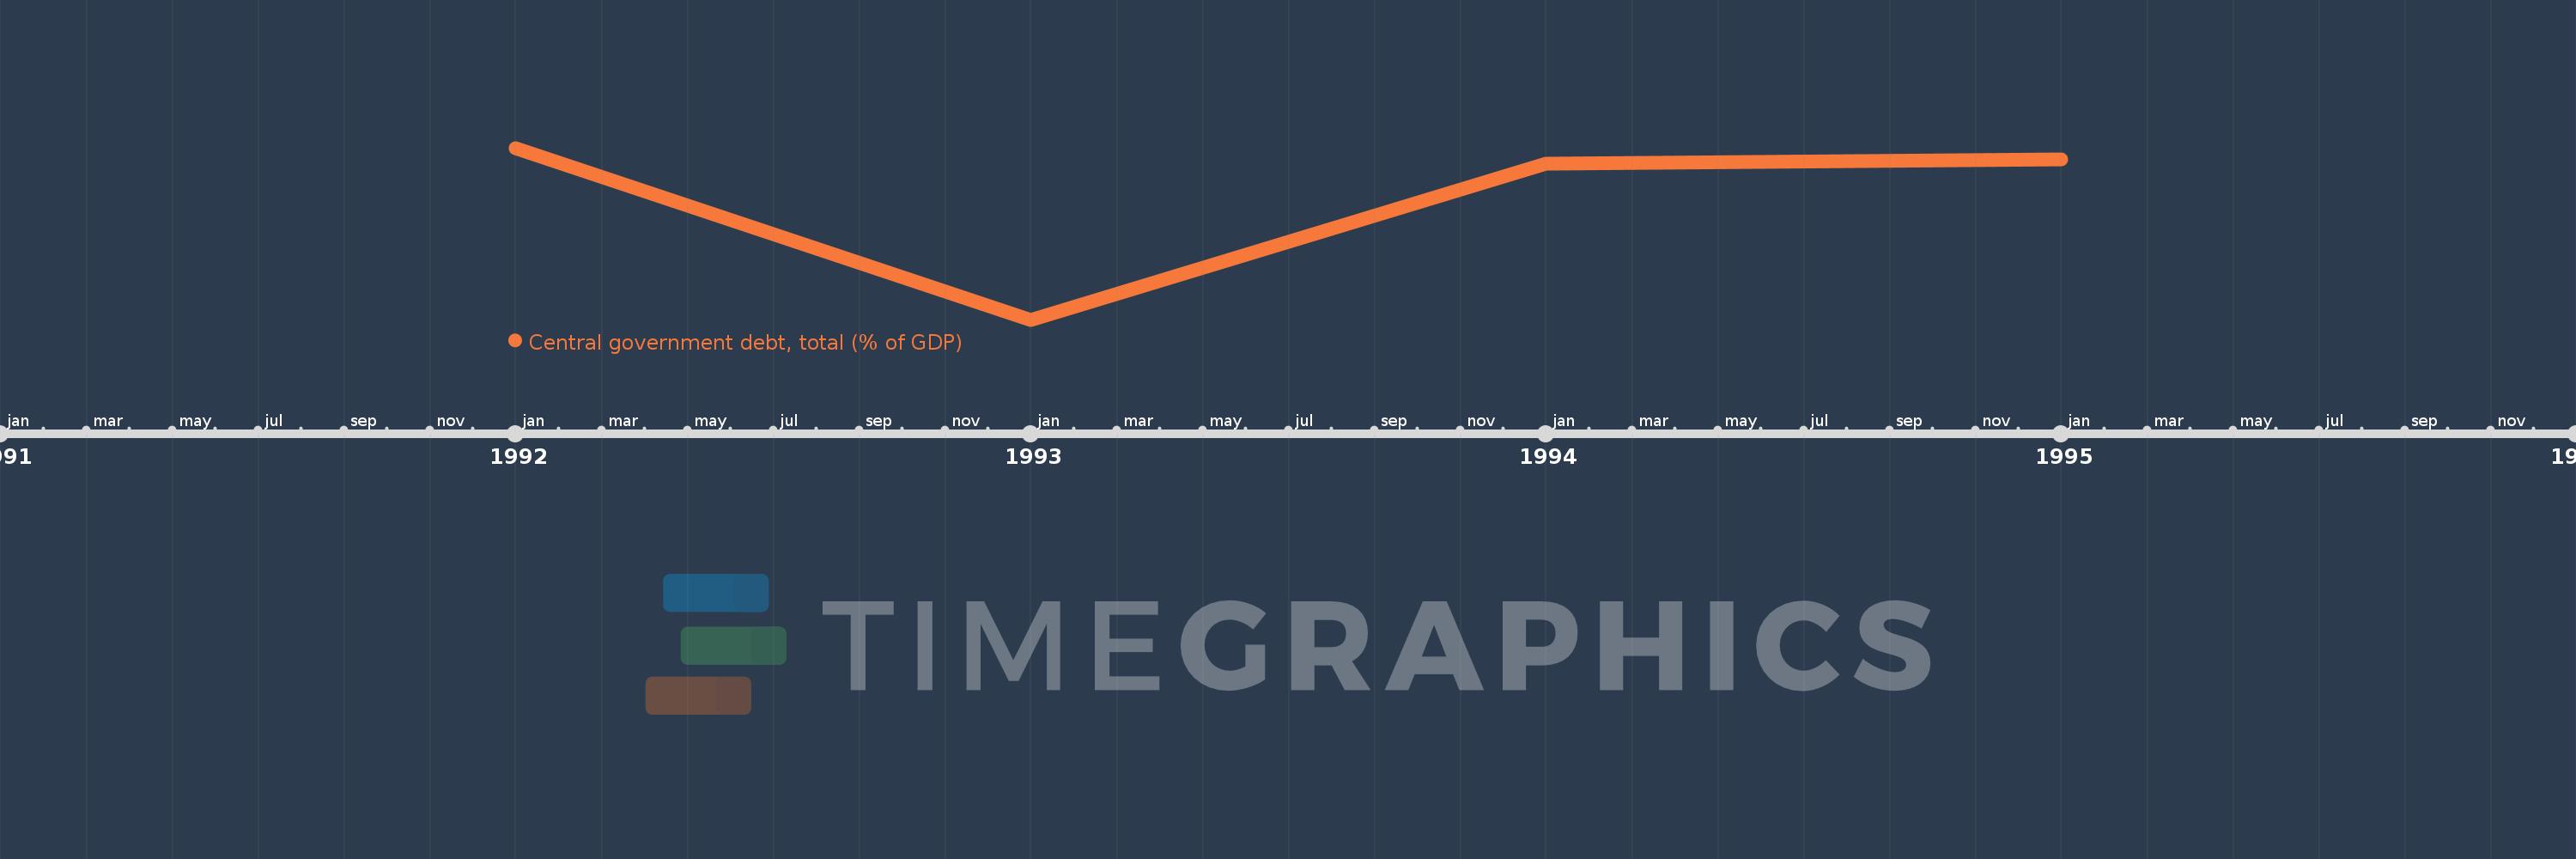
This timeline shows a graph from 1992 to 1995 of Fiji. No data until 1991. Number of actual observations by date: 4.
Source name:
World Development Indicators
Source organization:
International Monetary Fund, Government Finance Statistics Yearbook and data files, and World Bank and OECD GDP estimates.
Categories, topics:
Economy & Growth, Public Sector
Last updated:
apr 23, 2017
Indicators value changes by year
Minimum:
33.687
jan 1, 1993
Maximum:
36.842
jan 1, 1992
At the date of observation
Value
Absolute change
Change from the previous value
jan 1, 1992
36.842
+36.842
0.0%
jan 1, 1993
33.687
-3.155
-8.56%
jan 1, 1994
36.553
+2.866
8.51%
jan 1, 1995
36.638
+0.085
0.23%
Ranking of countries by current statistics by years