Download This statistics in other country:
Timeline:
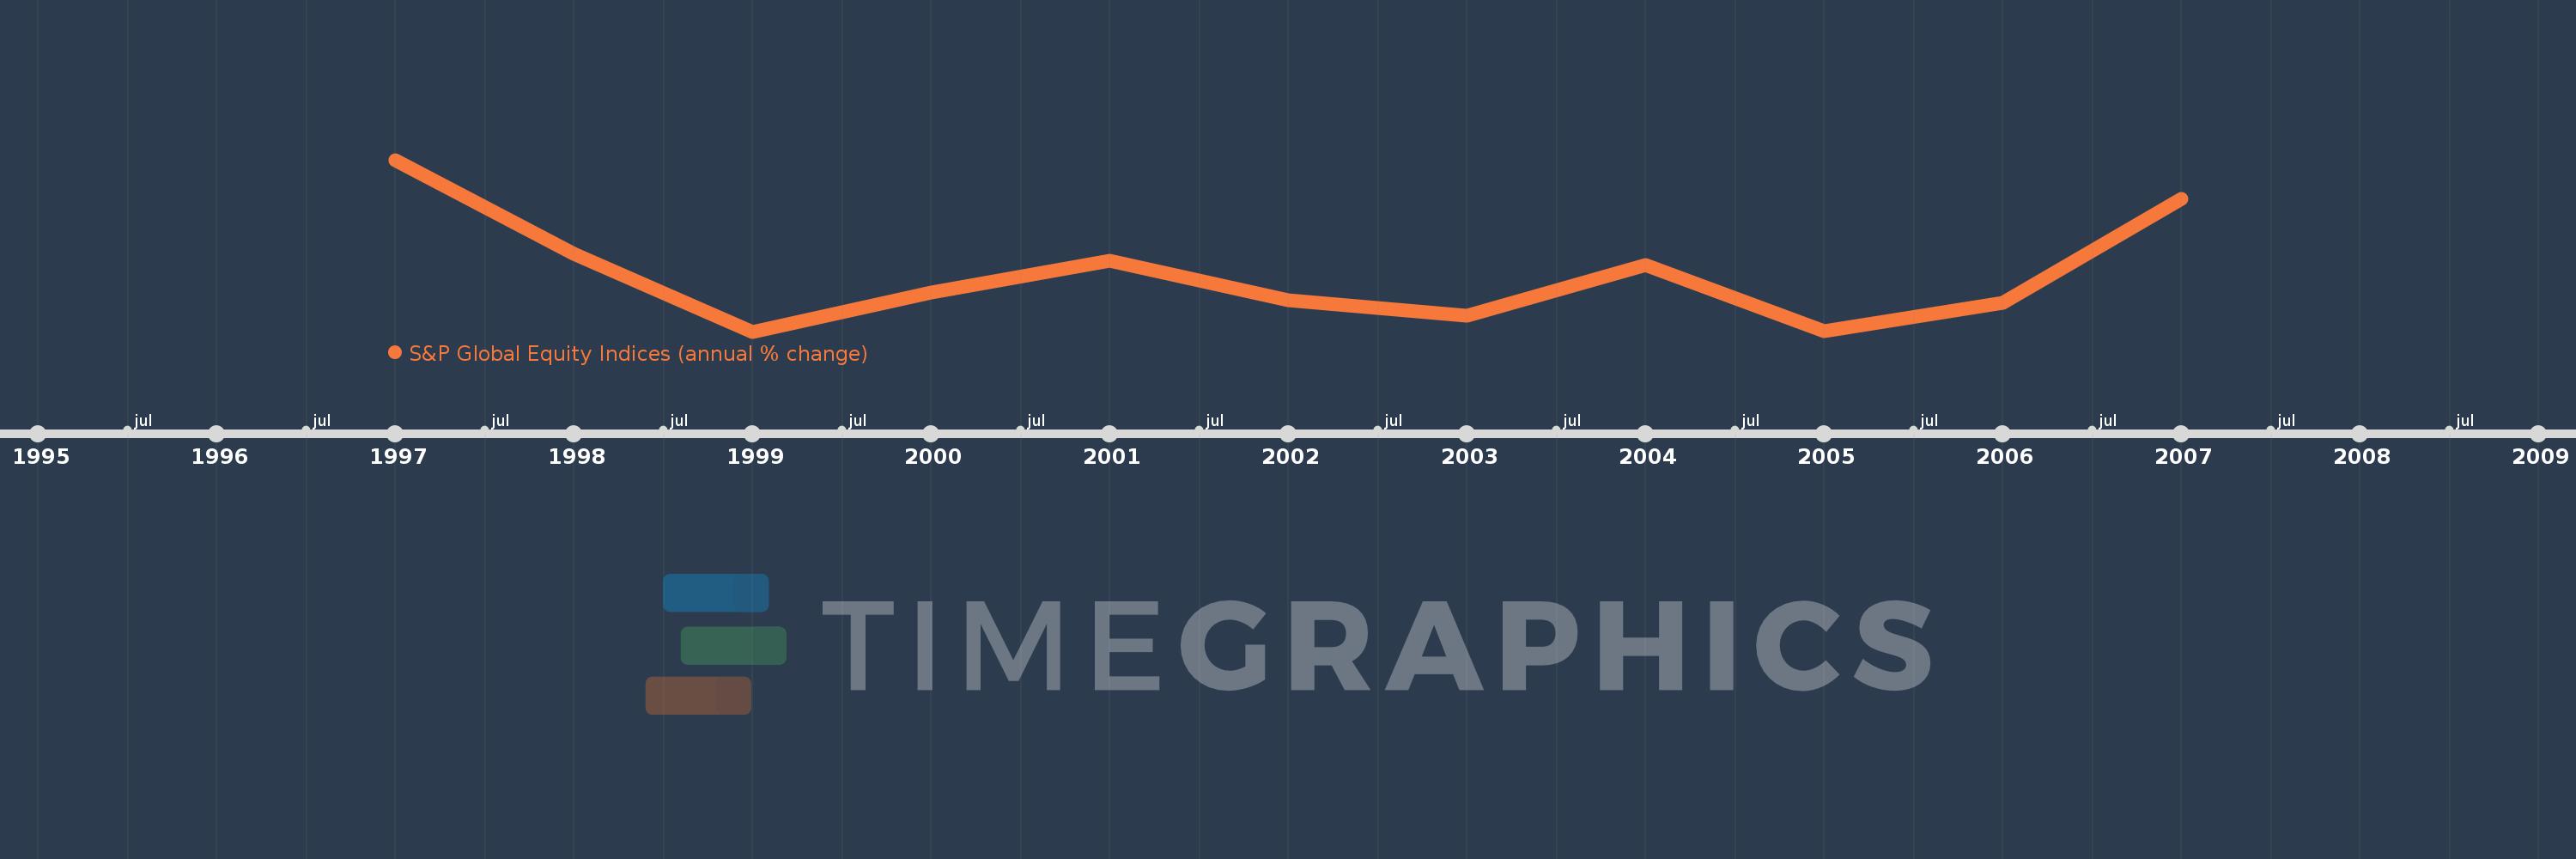
This timeline shows a graph from 1997 to 2007 of Venezuela, RB. No data until 1996. Number of actual observations by date: 11.
Source name:
World Development Indicators
Source organization:
Standard & Poor's, Global Stock Markets Factbook and supplemental S&P data.
Categories, topics:
Financial Sector
Last updated:
apr 23, 2017
Indicators value changes by year
Minimum:
-50.457
jan 1, 1999
At the date of observation
Value
Absolute change
Change from the previous value
jan 1, 1997
117.7
+117.7
0.0%
jan 1, 1998
25.691
-92.009
-78.17%
jan 1, 1999
-50.457
-76.147
-296.4%
jan 1, 2000
-12.4
+38.057
-75.42%
jan 1, 2001
18.735
+31.135
-251.09%
jan 1, 2002
-20.118
-38.854
-207.38%
jan 1, 2003
-35.13
-15.012
74.62%
jan 1, 2004
14.3
+49.43
-140.71%
jan 1, 2005
-50.4
-64.7
-452.45%
jan 1, 2006
-21.994
+28.406
-56.36%
jan 1, 2007
79.043
+101.037
-459.39%
Ranking of countries by current statistics by years