Download This statistics in other country:
Timeline:
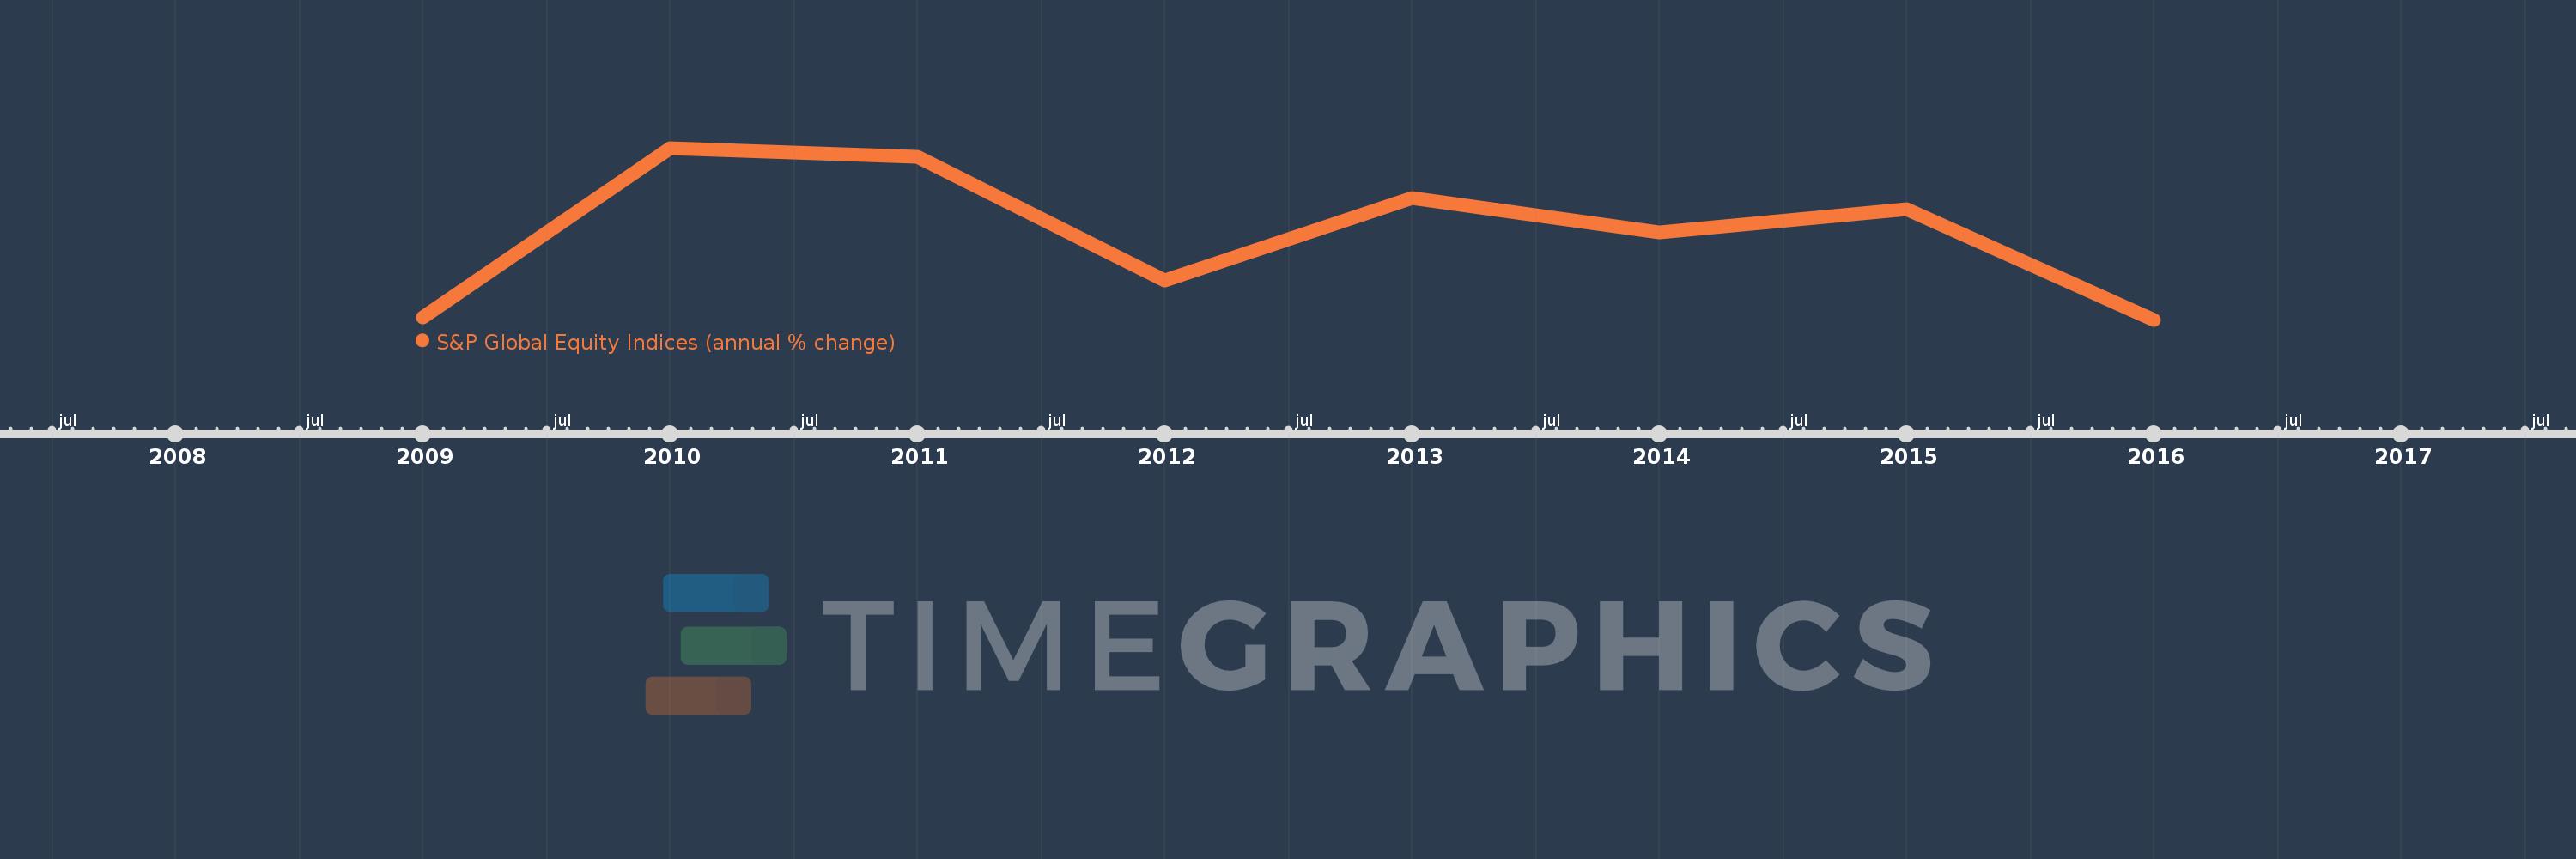
This timeline shows a graph from 2009 to 2016 of Kazakhstan. No data until 2008. Number of actual observations by date: 8.
Source name:
World Development Indicators
Source organization:
Standard & Poor's, Global Stock Markets Factbook and supplemental S&P data.
Categories, topics:
Financial Sector
Last updated:
apr 23, 2017
Indicators value changes by year
Minimum:
-47.636
jan 1, 2016
At the date of observation
Value
Absolute change
Change from the previous value
jan 1, 2009
-47.033
-47.033
0.0%
jan 1, 2010
1.532
+48.565
-103.26%
jan 1, 2011
-0.97
-2.502
-163.28%
jan 1, 2012
-36.403
-35.433
3.65K%
jan 1, 2013
-12.682
+23.721
-65.16%
jan 1, 2014
-22.512
-9.83
77.51%
jan 1, 2015
-15.985
+6.527
-28.99%
jan 1, 2016
-47.636
-31.651
198.0%
Ranking of countries by current statistics by years