Download This statistics in other country:
Timeline:
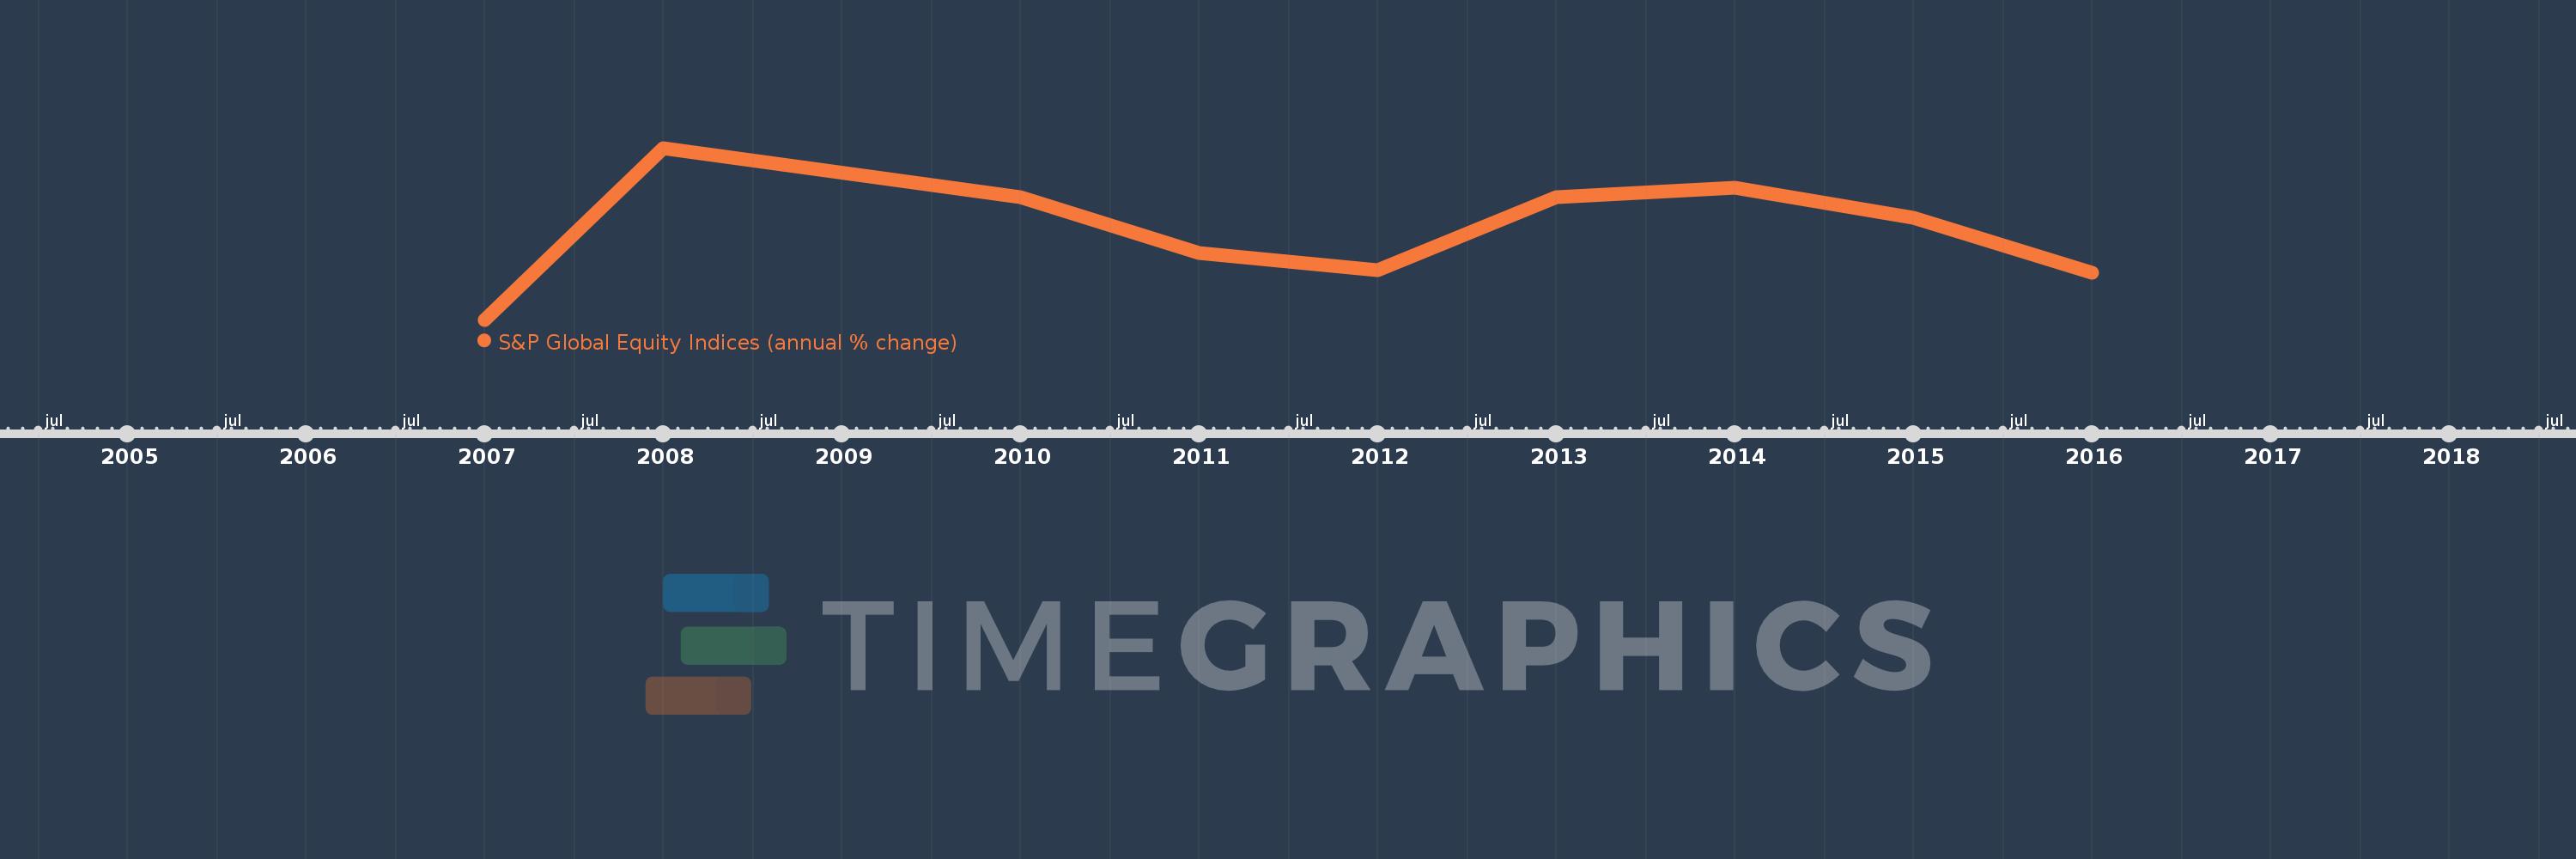
This timeline shows a graph from 2007 to 2016 of United Arab Emirates. No data until 2006. Number of actual observations by date: 9.
Source name:
World Development Indicators
Source organization:
Standard & Poor's, Global Stock Markets Factbook and supplemental S&P data.
Categories, topics:
Financial Sector
Last updated:
apr 23, 2017
Indicators value changes by year
Minimum:
-44.586
jan 1, 2007
Maximum:
52.132
jan 1, 2008
At the date of observation
Value
Absolute change
Change from the previous value
jan 1, 2007
-44.586
-44.586
0.0%
jan 1, 2008
52.132
+96.718
-216.92%
jan 1, 2010
24.574
-27.557
-52.86%
jan 1, 2011
-6.789
-31.363
-127.63%
jan 1, 2012
-16.479
-9.69
142.74%
jan 1, 2013
24.217
+40.696
-246.95%
jan 1, 2014
29.593
+5.376
22.2%
jan 1, 2015
12.742
-16.85
-56.94%
jan 1, 2016
-18.087
-30.83
-241.94%
Ranking of countries by current statistics by years