Download This statistics in other country:
Timeline:
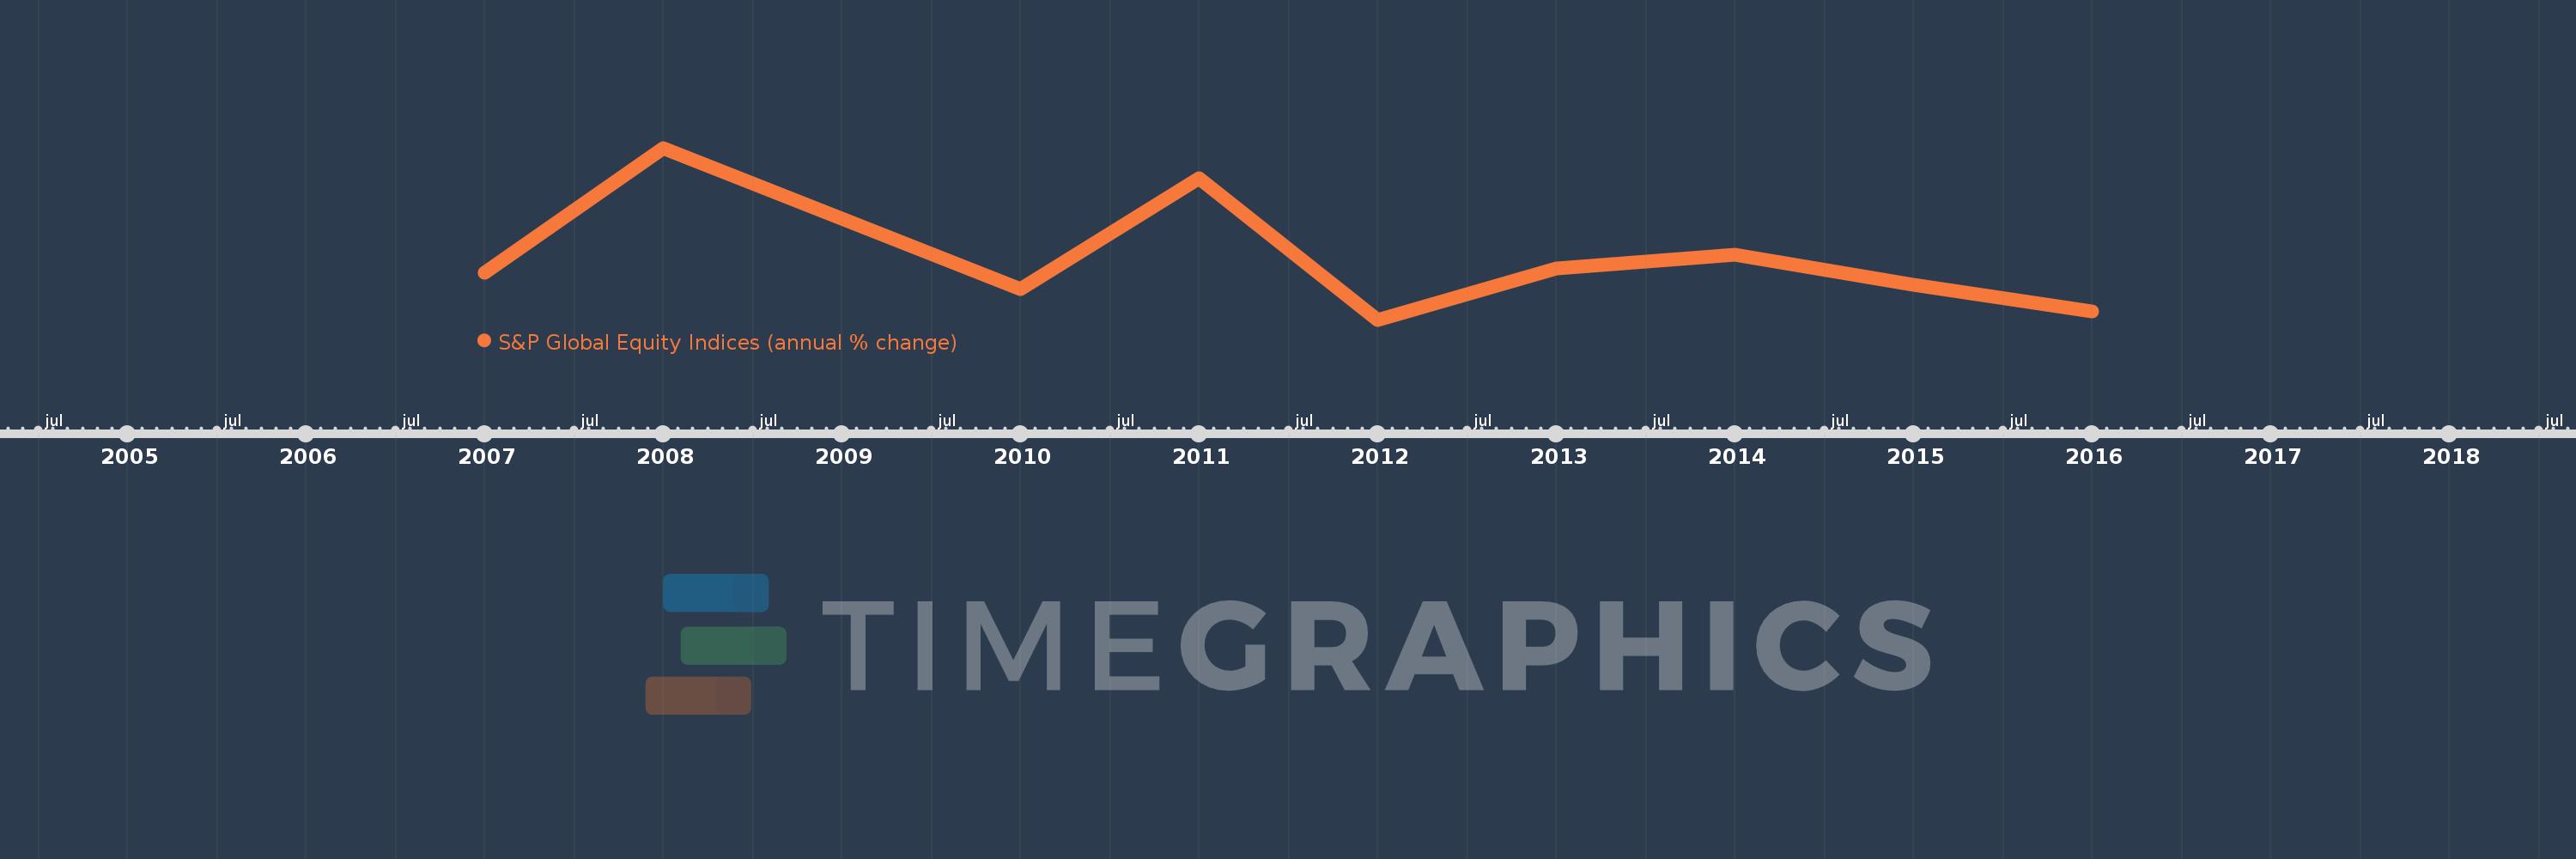
This timeline shows a graph from 2007 to 2016 of Kuwait. No data until 2006. Number of actual observations by date: 9.
Source name:
World Development Indicators
Source organization:
Standard & Poor's, Global Stock Markets Factbook and supplemental S&P data.
Categories, topics:
Financial Sector
Last updated:
apr 23, 2017
Indicators value changes by year
Minimum:
-21.356
jan 1, 2012
Maximum:
39.939
jan 1, 2008
At the date of observation
Value
Absolute change
Change from the previous value
jan 1, 2007
-4.587
-4.587
0.0%
jan 1, 2008
39.939
+44.526
-970.7%
jan 1, 2010
-10.408
-50.347
-126.06%
jan 1, 2011
29.124
+39.532
-379.83%
jan 1, 2012
-21.356
-50.48
-173.33%
jan 1, 2013
-2.985
+18.371
-86.02%
jan 1, 2014
1.699
+4.684
-156.9%
jan 1, 2015
-8.734
-10.432
-614.2%
jan 1, 2016
-18.307
-9.573
109.61%
Ranking of countries by current statistics by years