Download This statistics in other country:
Timeline:
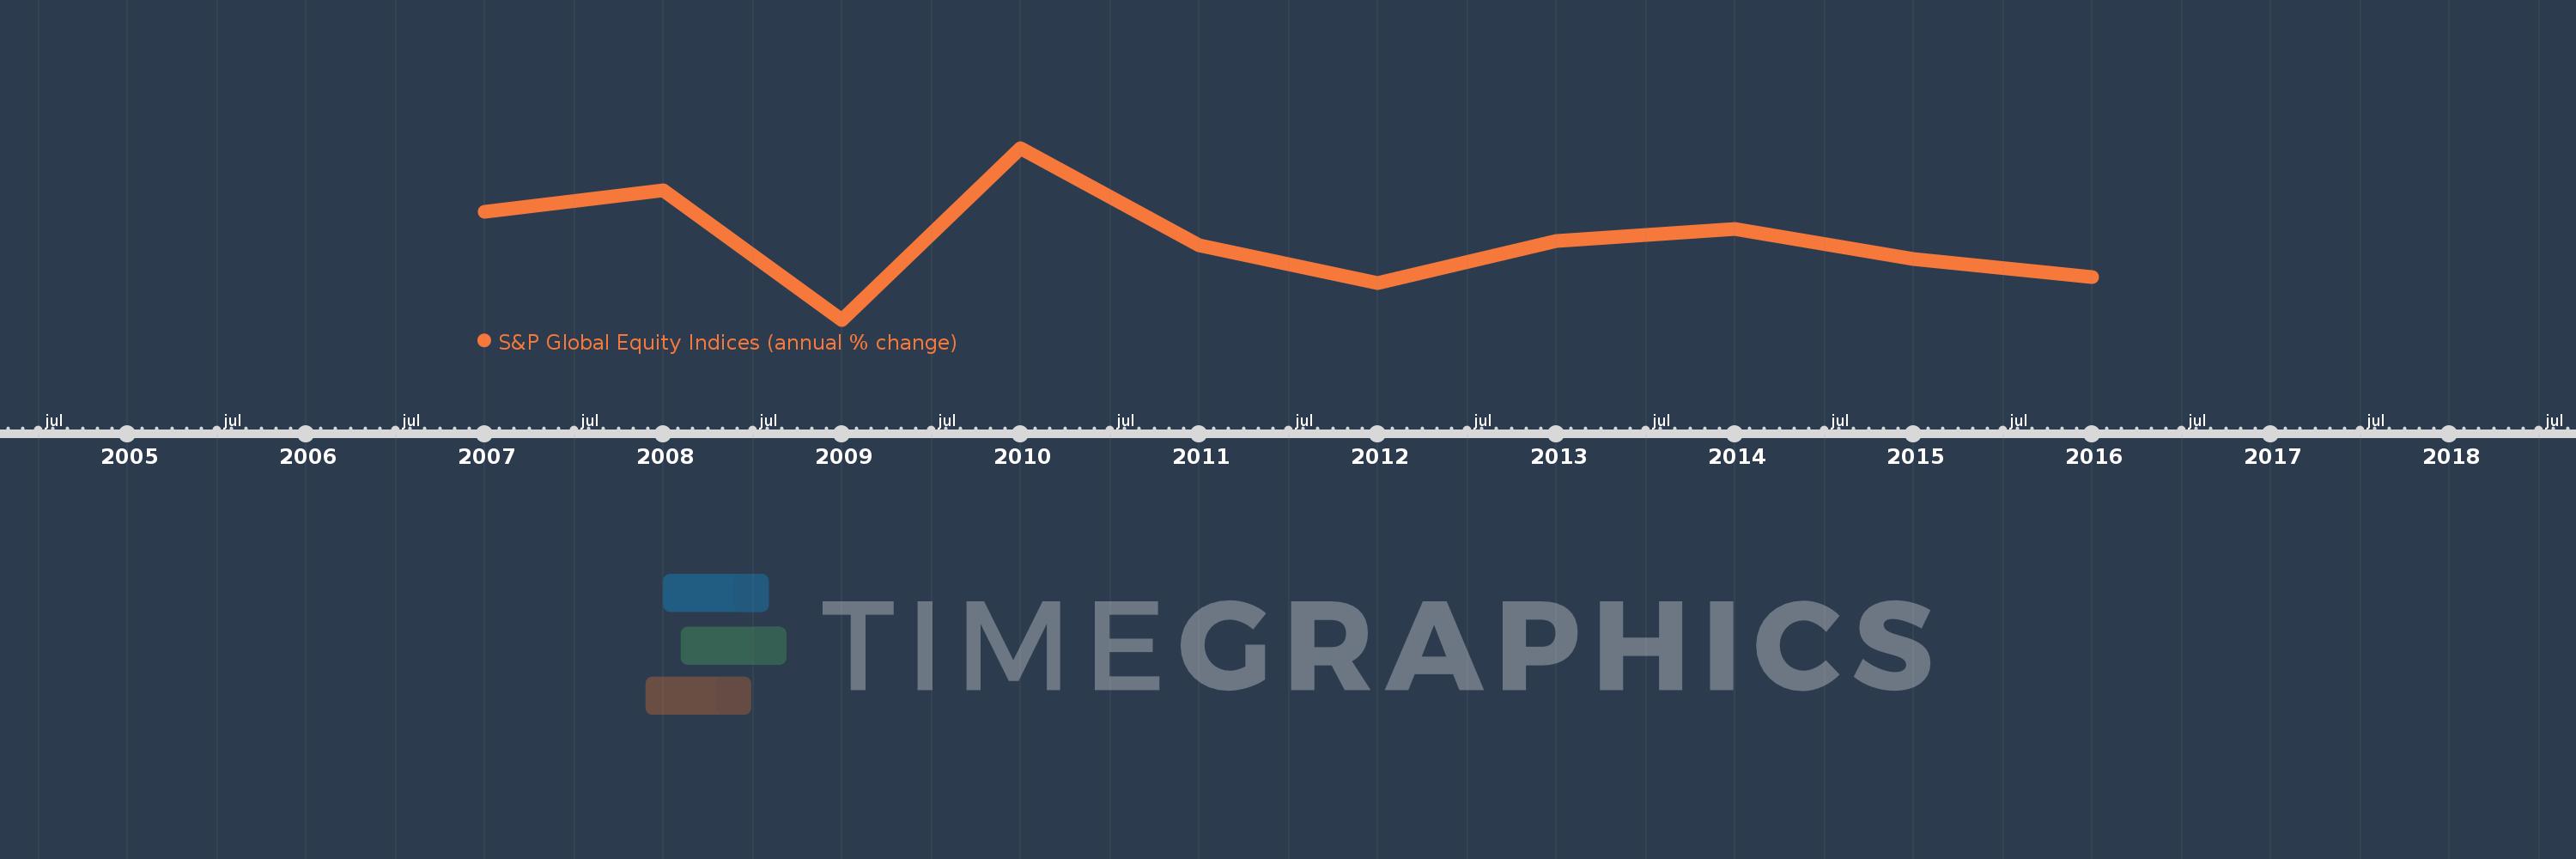
This timeline shows a graph from 2007 to 2016 of Luxembourg. No data until 2006. Number of actual observations by date: 10.
Source name:
World Development Indicators
Source organization:
Standard & Poor's, Global Stock Markets Factbook and supplemental S&P data.
Categories, topics:
Financial Sector
Last updated:
apr 23, 2017
Indicators value changes by year
Minimum:
-64.261
jan 1, 2009
Maximum:
76.732
jan 1, 2010
At the date of observation
Value
Absolute change
Change from the previous value
jan 1, 2007
24.381
+24.381
0.0%
jan 1, 2008
41.874
+17.493
71.75%
jan 1, 2009
-64.261
-106.135
-253.46%
jan 1, 2010
76.732
+140.993
-219.41%
jan 1, 2011
-3.345
-80.076
-104.36%
jan 1, 2012
-34.447
-31.102
929.87%
jan 1, 2013
0.553
+34.999
-101.6%
jan 1, 2014
9.959
+9.406
1.7K%
jan 1, 2015
-14.354
-24.312
-244.13%
jan 1, 2016
-29.26
-14.906
103.85%
Ranking of countries by current statistics by years