33
/
AIzaSyB4mHJ5NPEv-XzF7P6NDYXjlkCWaeKw5bc
November 30, 2025
213644
Nigeria
NGA
true
2
1
S&P Global Equity Indices (annual % change)
2016,2015,2014,2013,2012,2011,2010,2008,2007,2006,2005,2004,2003,2002,2000,1999,1998
Create a timeline
Public Timelines
For education
For educational institutions
For teachers
For students
Cabinet
For educational institutions
For teachers
For students
Open cabinet
FAQ
Close
Create a timeline
Public timelines
FAQ
About & Feedback
Terms
Privacy
FAQ
Support 24/7
Cabinet
Get premium
Donate
Download
Global statistics library
→
Nigeria
→
S&P Global Equity Indices (annual % change)
This statistics in other country:
Argentina
Australia
Austria
Bahrain
Bangladesh
Belgium
Botswana
Brazil
Bulgaria
Canada
Chile
China
Colombia
Cote d'Ivoire
Croatia
Cyprus
Czech Republic
Denmark
Ecuador
Egypt, Arab Rep.
Estonia
Finland
France
Germany
Ghana
Greece
Hong Kong SAR, China
Hungary
India
Indonesia
Ireland
Israel
Italy
Jamaica
Japan
Jordan
Kazakhstan
Kenya
Korea, Rep.
Kuwait
Latvia
Lebanon
Lithuania
Luxembourg
Malaysia
Mauritius
Mexico
Morocco
Namibia
Netherlands
New Zealand
Nigeria
Norway
Oman
Pakistan
Panama
Peru
Philippines
Poland
Portugal
Qatar
Romania
Russian Federation
Saudi Arabia
Singapore
Slovak Republic
Slovenia
South Africa
Spain
Sri Lanka
Sweden
Switzerland
Thailand
Trinidad and Tobago
Tunisia
Turkey
Ukraine
United Arab Emirates
United Kingdom
United States
Venezuela, RB
Vietnam
Zambia
Zimbabwe
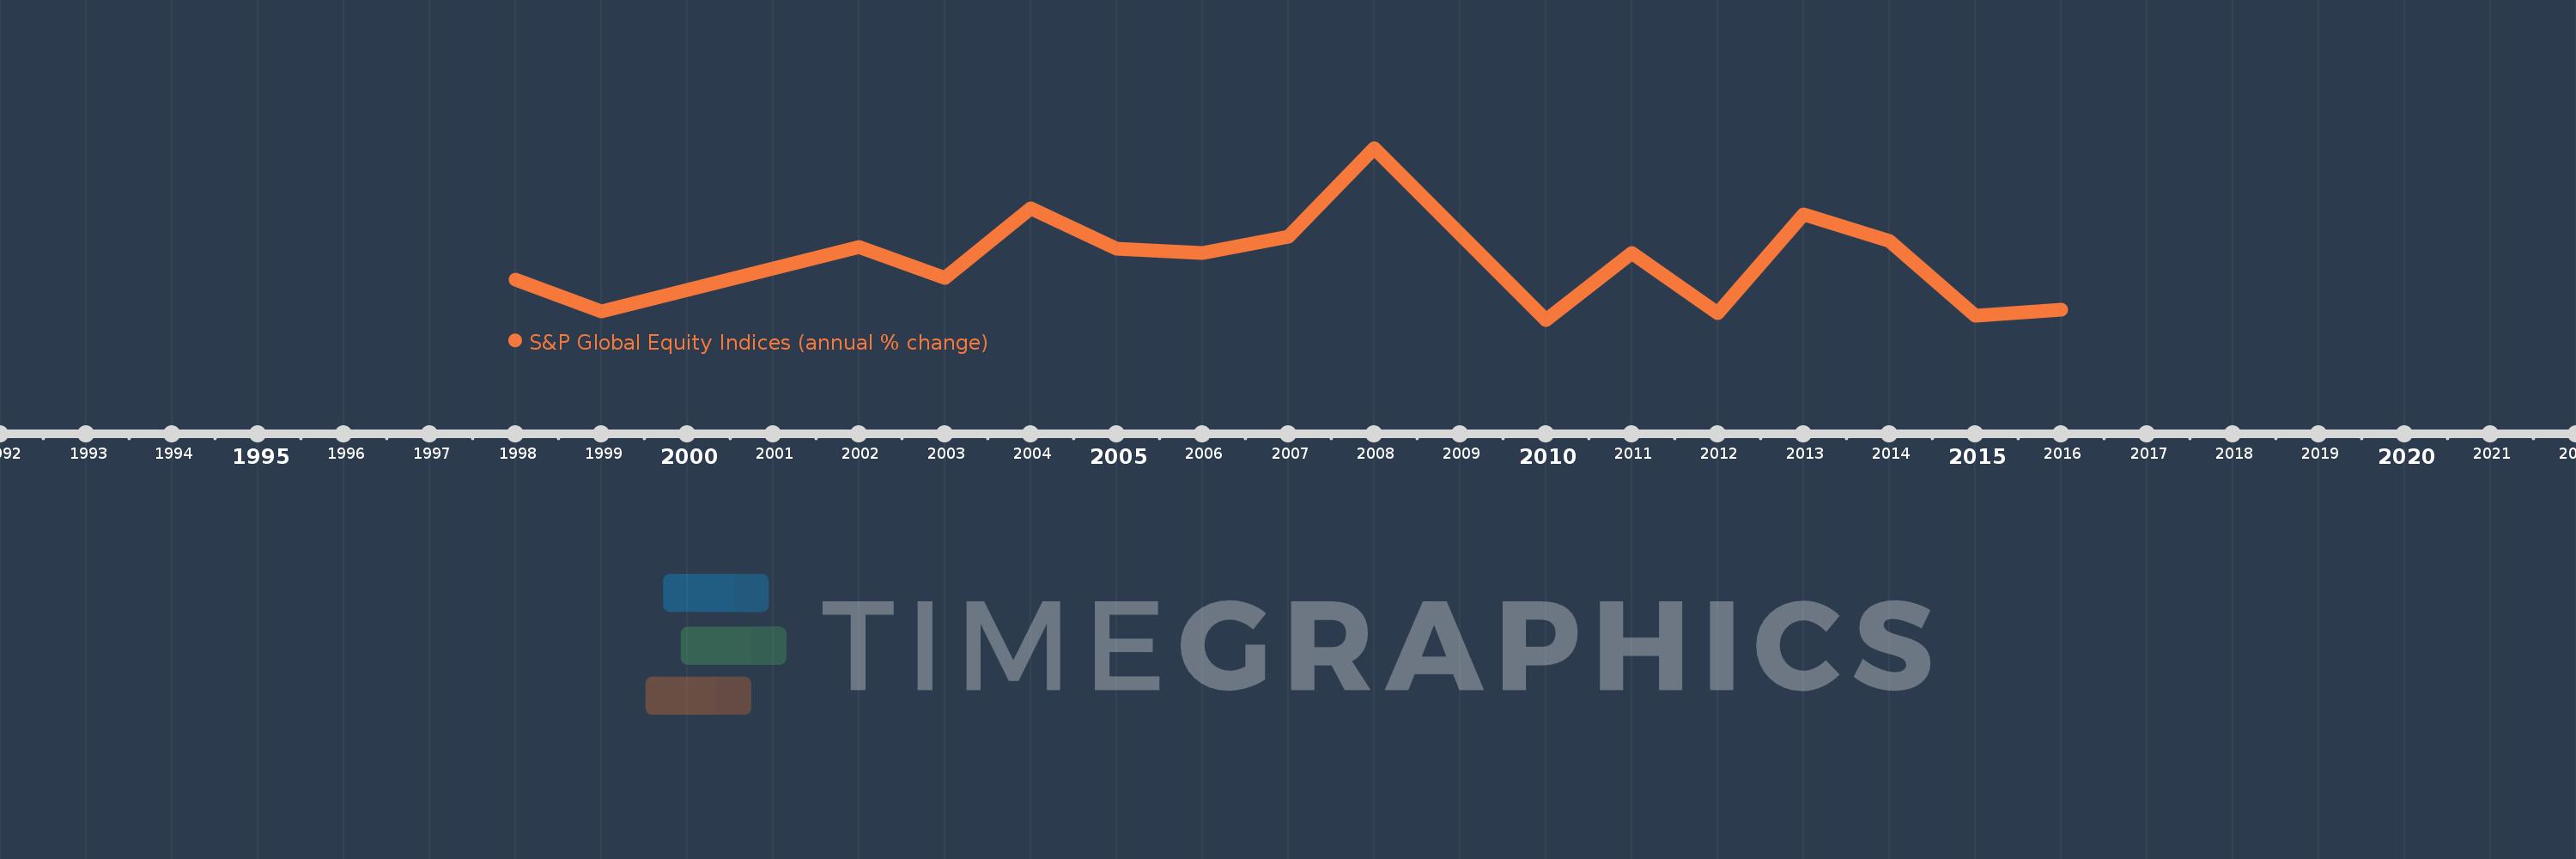
Timeline:
This timeline shows a graph from
1998
to
2016
of Nigeria. No data until
1997
. Number of actual observations by date:
17
.
Source name:
World Development Indicators
Source organization:
Standard & Poor's, Global Stock Markets Factbook and supplemental S&P data.
Categories, topics:
Financial Sector
Last updated:
apr 23, 2017
Indicators value changes by year
Meaning:
12.256
Minimum:
-35.399
jan 1, 2010
Maximum:
108.303
jan 1, 2008
At the date of observation
Value
Absolute change
Change from the previous value
jan 1, 1998
-1.89
-1.89
0.0%
jan 1, 1999
-28.45
-26.56
1.41K%
jan 1, 2000
-10.3
+18.15
-63.8%
jan 1, 2002
25.104
+35.404
-343.73%
jan 1, 2003
-0.28
-25.384
-101.12%
jan 1, 2004
57.54
+57.82
-20.65K%
jan 1, 2005
23.9
-33.64
-58.46%
jan 1, 2006
20.693
-3.207
-13.42%
jan 1, 2007
33.953
+13.26
64.08%
jan 1, 2008
108.303
+74.35
218.98%
jan 1, 2010
-35.399
-143.702
-132.68%
jan 1, 2011
20.292
+55.691
-157.32%
jan 1, 2012
-29.543
-49.835
-245.59%
jan 1, 2013
52.949
+82.491
-279.23%
jan 1, 2014
30.162
-22.786
-43.03%
jan 1, 2015
-31.855
-62.018
-205.61%
jan 1, 2016
-26.828
+5.027
-15.78%
Ranking of countries by current statistics by years
About & Feedback
Terms
Privacy
FAQ
Support 24/7
Cabinet
Get premium
Donate
The service accepts bank transfer (ACH, Wire) or cards (Visa, MasterCard, etc). Processed by Stripe.
Secured with SSL