Download This statistics in other country:
Timeline:
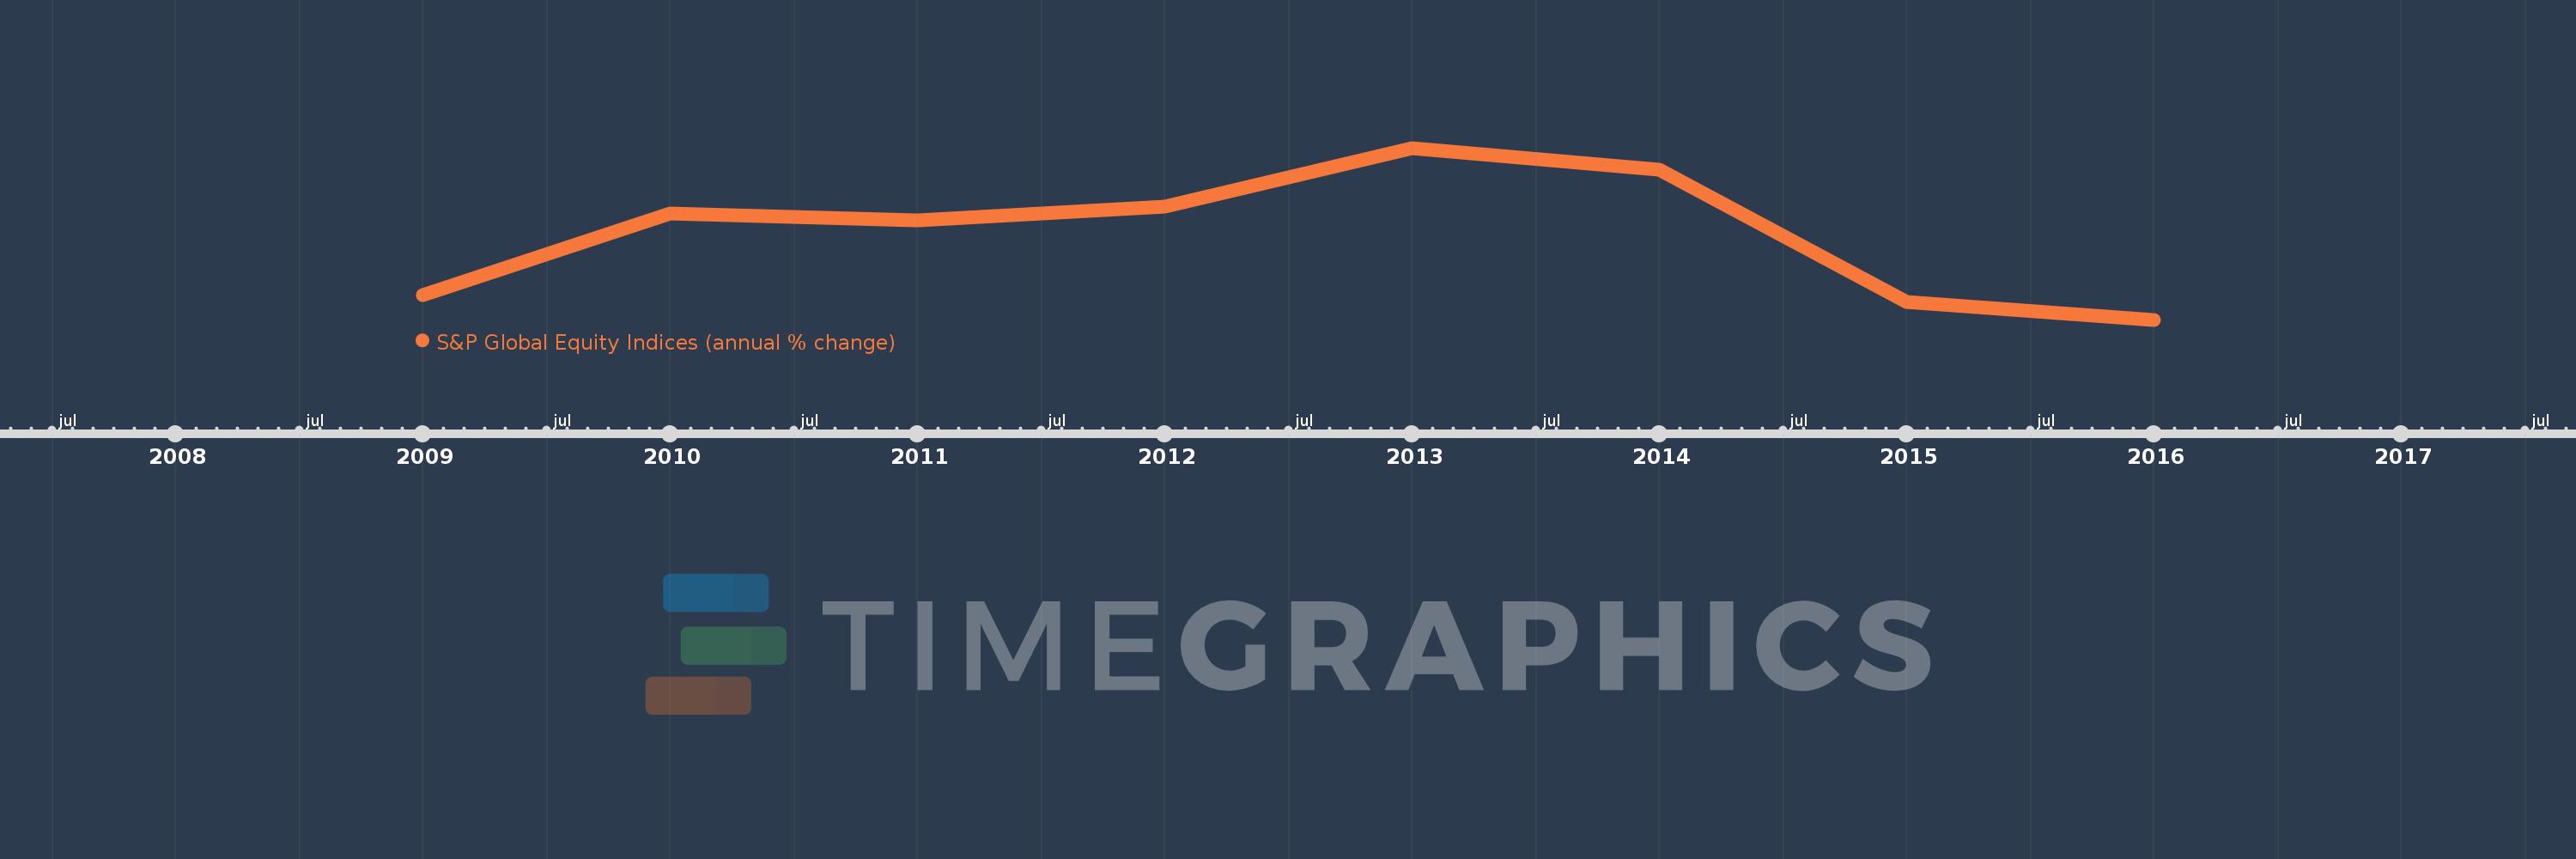
This timeline shows a graph from 2009 to 2016 of Panama. No data until 2008. Number of actual observations by date: 8.
Source name:
World Development Indicators
Source organization:
Standard & Poor's, Global Stock Markets Factbook and supplemental S&P data.
Categories, topics:
Financial Sector
Last updated:
apr 23, 2017
Indicators value changes by year
Minimum:
-25.192
jan 1, 2016
At the date of observation
Value
Absolute change
Change from the previous value
jan 1, 2009
-15.702
-15.702
0.0%
jan 1, 2010
15.447
+31.149
-198.37%
jan 1, 2011
12.835
-2.612
-16.91%
jan 1, 2012
18.037
+5.203
40.53%
jan 1, 2013
40.43
+22.392
124.15%
jan 1, 2014
32.27
-8.159
-20.18%
jan 1, 2015
-18.427
-50.697
-157.1%
jan 1, 2016
-25.192
-6.765
36.71%
Ranking of countries by current statistics by years