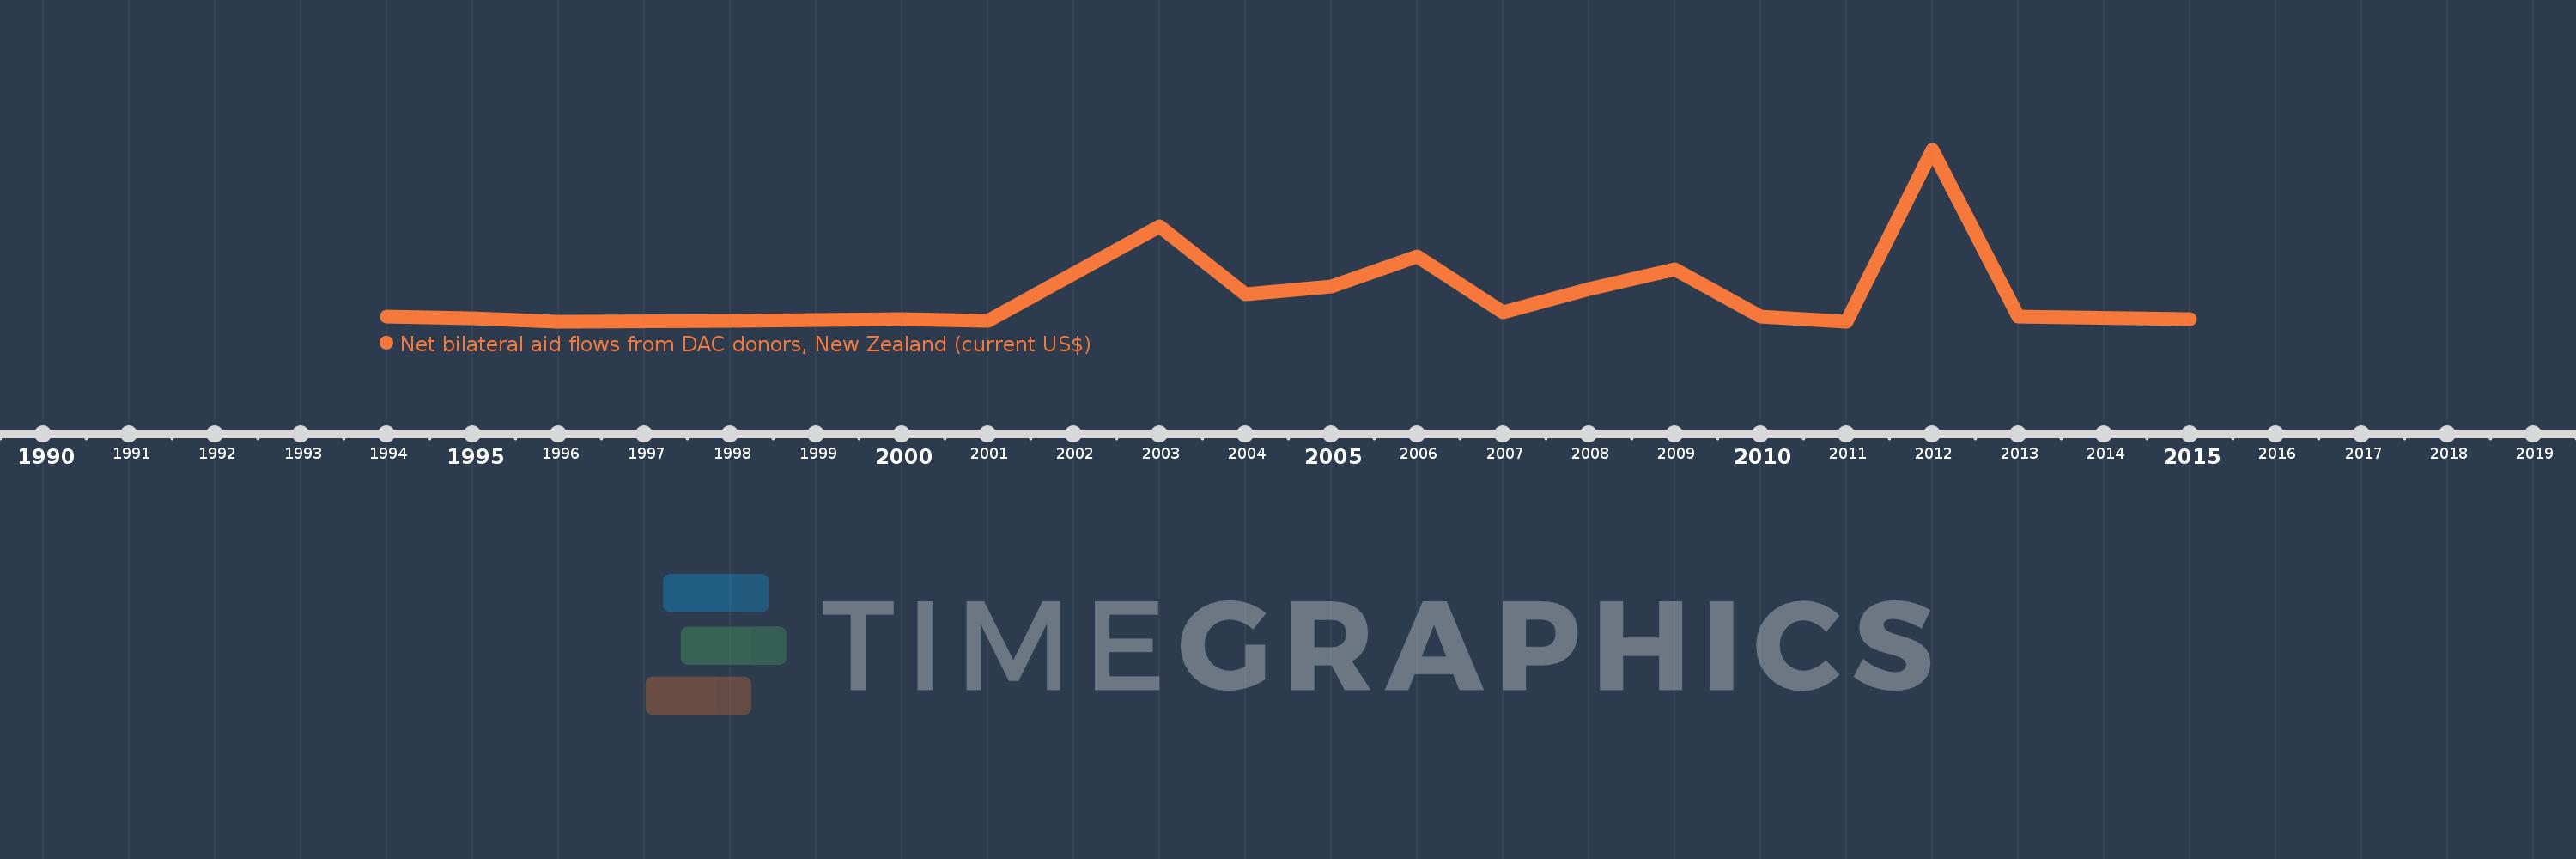
This timeline shows a graph from 1994 to 2015 of Somalia. No data until 1993. Number of actual observations by date: 18.
Source name:
World Development Indicators
Source organization:
Development Assistance Committee of the Organisation for Economic Co-operation and Development, Geographical Distribution of Financial Flows to Developing Countries, Development Co-operation Report, and International Development Statistics database. Data are available online at: www.oecd.org/dac/stats/idsonline.
Categories, topics:
Aid Effectiveness
Last updated:
apr 23, 2017
Indicators value changes by year
Meaning:
453.333K
Minimum:
30.0K
jan 1, 1996
Maximum:
2.55 mln
jan 1, 2012
At the date of observation
Value
Absolute change
Change from the previous value
jan 1, 1994
110.0K
+110.0K
0.0%
jan 1, 1995
80.0K
-30.0K
-27.27%
jan 1, 1996
30.0K
-50.0K
-62.5%
jan 1, 1998
50.0K
+20.0K
66.67%
jan 1, 2000
70.0K
+20.0K
40.0%
jan 1, 2001
50.0K
-20.0K
-28.57%
jan 1, 2003
1.43 mln
+1.38 mln
2.76K%
jan 1, 2004
440.0K
-990.0K
-69.23%
jan 1, 2005
550.0K
+110.0K
25.0%
jan 1, 2006
990.0K
+440.0K
80.0%
jan 1, 2007
170.0K
-820.0K
-82.83%
jan 1, 2008
510.0K
+340.0K
200.0%
jan 1, 2009
800.0K
+290.0K
56.86%
jan 1, 2010
110.0K
-690.0K
-86.25%
jan 1, 2011
40.0K
-70.0K
-63.64%
jan 1, 2012
2.55 mln
+2.51 mln
6.28K%
jan 1, 2013
110.0K
-2.44 mln
-95.69%
jan 1, 2015
70.0K
-40.0K
-36.36%
Ranking of countries by current statistics by years