29
/
en
AIzaSyAYiBZKx7MnpbEhh9jyipgxe19OcubqV5w
April 1, 2024
158717
Iraq
IRQ
true
2
1
Net bilateral aid flows from DAC donors, New Zealand (current US$)
2015,2011,2009,2008,2007,2006,2005,2004,2003,2001,1996,1979
Download
Global statistics library →Iraq →

Net bilateral aid flows from DAC donors, New Zealand (current US$)

This statistics in other country:
AfghanistanAlgeriaAngolaAntigua and BarbudaArab WorldArgentinaBahamas, TheBangladeshBarbadosBelizeBeninBhutanBoliviaBosnia and HerzegovinaBotswanaBrazilBrunei DarussalamBurkina FasoBurundiCambodiaCameroonCaribbean small statesCentral African RepublicCentral Europe and the BalticsChadChileChinaColombiaComorosCongo, Dem. Rep.Costa RicaCote d'IvoireCyprusCzech RepublicDjiboutiDominicaEast Asia & PacificEast Asia & Pacific (excluding high income)East Asia & Pacific (IDA & IBRD countries)EcuadorEgypt, Arab Rep.El SalvadorEritreaEthiopiaEuro areaEurope & Central AsiaEurope & Central Asia (excluding high income)Europe & Central Asia (IDA & IBRD countries)European UnionFijiFragile and conflict affected situationsFrench PolynesiaGambia, TheGhanaGrenadaGuatemalaGuinea-BissauGuyanaHaitiHeavily indebted poor countries (HIPC)High incomeHondurasHong Kong SAR, ChinaHungaryIBRD onlyIDA & IBRD totalIDA blendIDA onlyIDA totalIndiaIndonesiaIran, Islamic Rep.IraqIsraelJamaicaJordanKazakhstanKenyaKiribatiKorea, Dem. People’s Rep.Korea, Rep.KuwaitKyrgyz RepublicLao PDRLatin America & Caribbean Latin America & Caribbean (excluding high income)Latin America & the Caribbean (IDA & IBRD countries)Least developed countries: UN classificationLebanonLesothoLiberiaLibyaLow & middle incomeLow incomeLower middle incomeMadagascarMalawiMalaysiaMaldivesMaliMaltaMarshall IslandsMauritaniaMauritiusMexicoMicronesia, Fed. Sts.Middle East & North AfricaMiddle East & North Africa (excluding high income)Middle East & North Africa (IDA & IBRD countries)Middle incomeMongoliaMoroccoMozambiqueMyanmarNamibiaNauruNepalNew CaledoniaNicaraguaNigerNigeriaNorthern Mariana IslandsOECD membersOther small statesPacific island small statesPakistanPalauPapua New GuineaParaguayPeruPhilippinesRussian FederationRwandaSamoaSenegalSerbiaSeychellesSierra LeoneSingaporeSlovak RepublicSmall statesSolomon IslandsSomaliaSouth AfricaSouth AsiaSouth Asia (IDA & IBRD)South SudanSri LankaSt. LuciaSt. Vincent and the GrenadinesSub-Saharan Africa Sub-Saharan Africa (excluding high income)Sub-Saharan Africa (IDA & IBRD countries)SudanSurinameSwazilandSyrian Arab RepublicTajikistanTanzaniaThailandTimor-LesteTongaTrinidad and TobagoTunisiaTurkeyTurkmenistanTuvaluUgandaUpper middle incomeUruguayUzbekistanVanuatuVenezuela, RBVietnamWest Bank and GazaWorldYemen, Rep.ZambiaZimbabwe
Timeline:
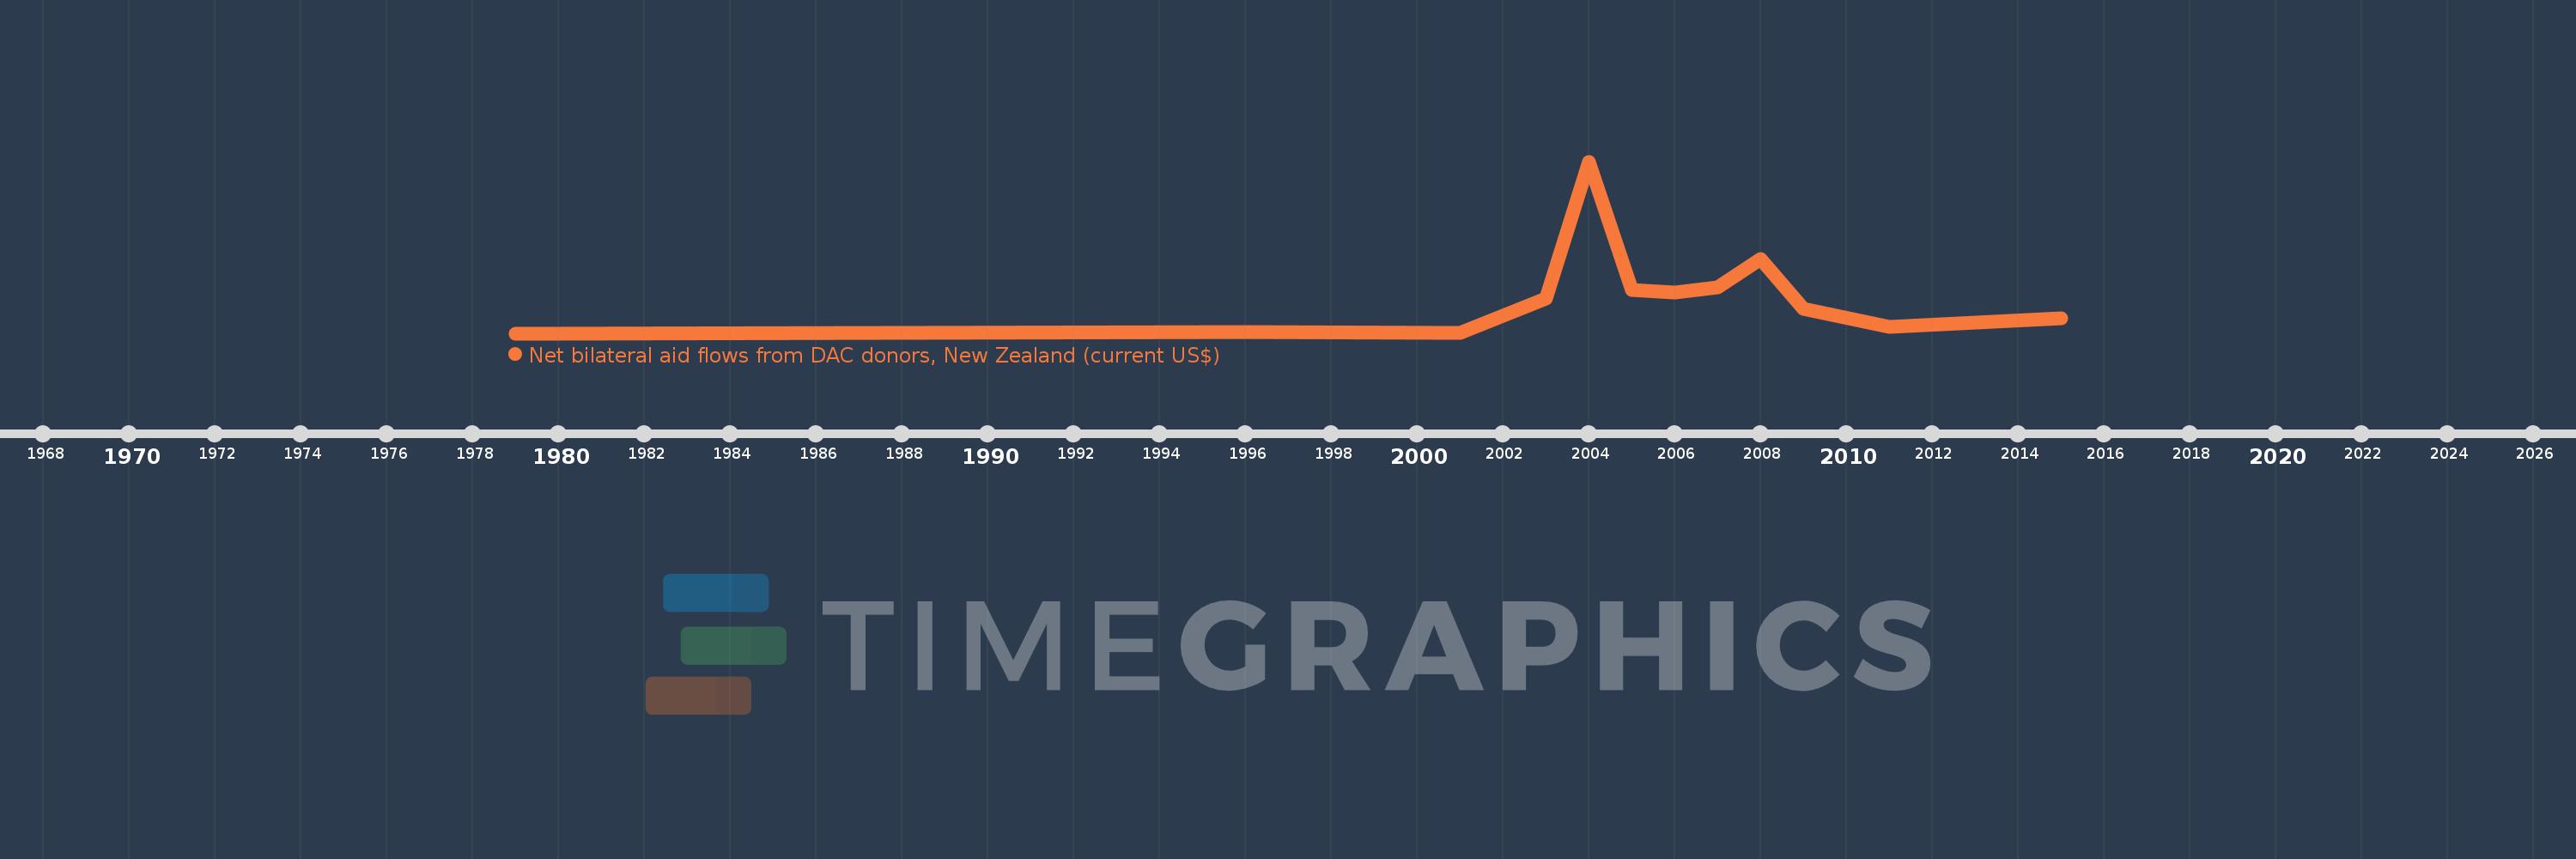
This timeline shows a graph from 1979 to 2015 of Iraq. No data until 1978. Number of actual observations by date: 12.
Source name:
World Development Indicators
Source organization:
Development Assistance Committee of the Organisation for Economic Co-operation and Development, Geographical Distribution of Financial Flows to Developing Countries, Development Co-operation Report, and International Development Statistics database. Data are available online at: www.oecd.org/dac/stats/idsonline.
Categories, topics:
Aid Effectiveness
Last updated:
apr 23, 2017
Indicators value changes by year
Mean:
2.152 mln
Minimum:
10.0K
jan 1, 1979
Maximum:
9.64 mln
jan 1, 2004
At the date of observation
Value
Absolute change
Change from previous value
jan 1, 1979
10.0K
+10.0K
0.0%
jan 1, 1996
70.0K
+60.0K
600.0%
jan 1, 2001
50.0K
-20.0K
-28.57%
jan 1, 2003
1.94 mln
+1.89 mln
3.78K%
jan 1, 2004
9.64 mln
+7.7 mln
396.91%
jan 1, 2005
2.43 mln
-7.21 mln
-74.79%
jan 1, 2006
2.32 mln
-110.0K
-4.53%
jan 1, 2007
2.6 mln
+280.0K
12.07%
jan 1, 2008
4.19 mln
+1.59 mln
61.15%
jan 1, 2009
1.38 mln
-2.81 mln
-67.06%
jan 1, 2011
360.0K
-1.02 mln
-73.91%
jan 1, 2015
830.0K
+470.0K
130.56%
Ranking of countries by current statistics by years

Comments:

Send
PremiumAbout & FeedbackTermsPrivacy
logo
© 2022 Selected Technologies LLC – Morgan Hill, California