33
/
AIzaSyB4mHJ5NPEv-XzF7P6NDYXjlkCWaeKw5bc
November 30, 2025
123843
Ecuador
ECU
true
2
1
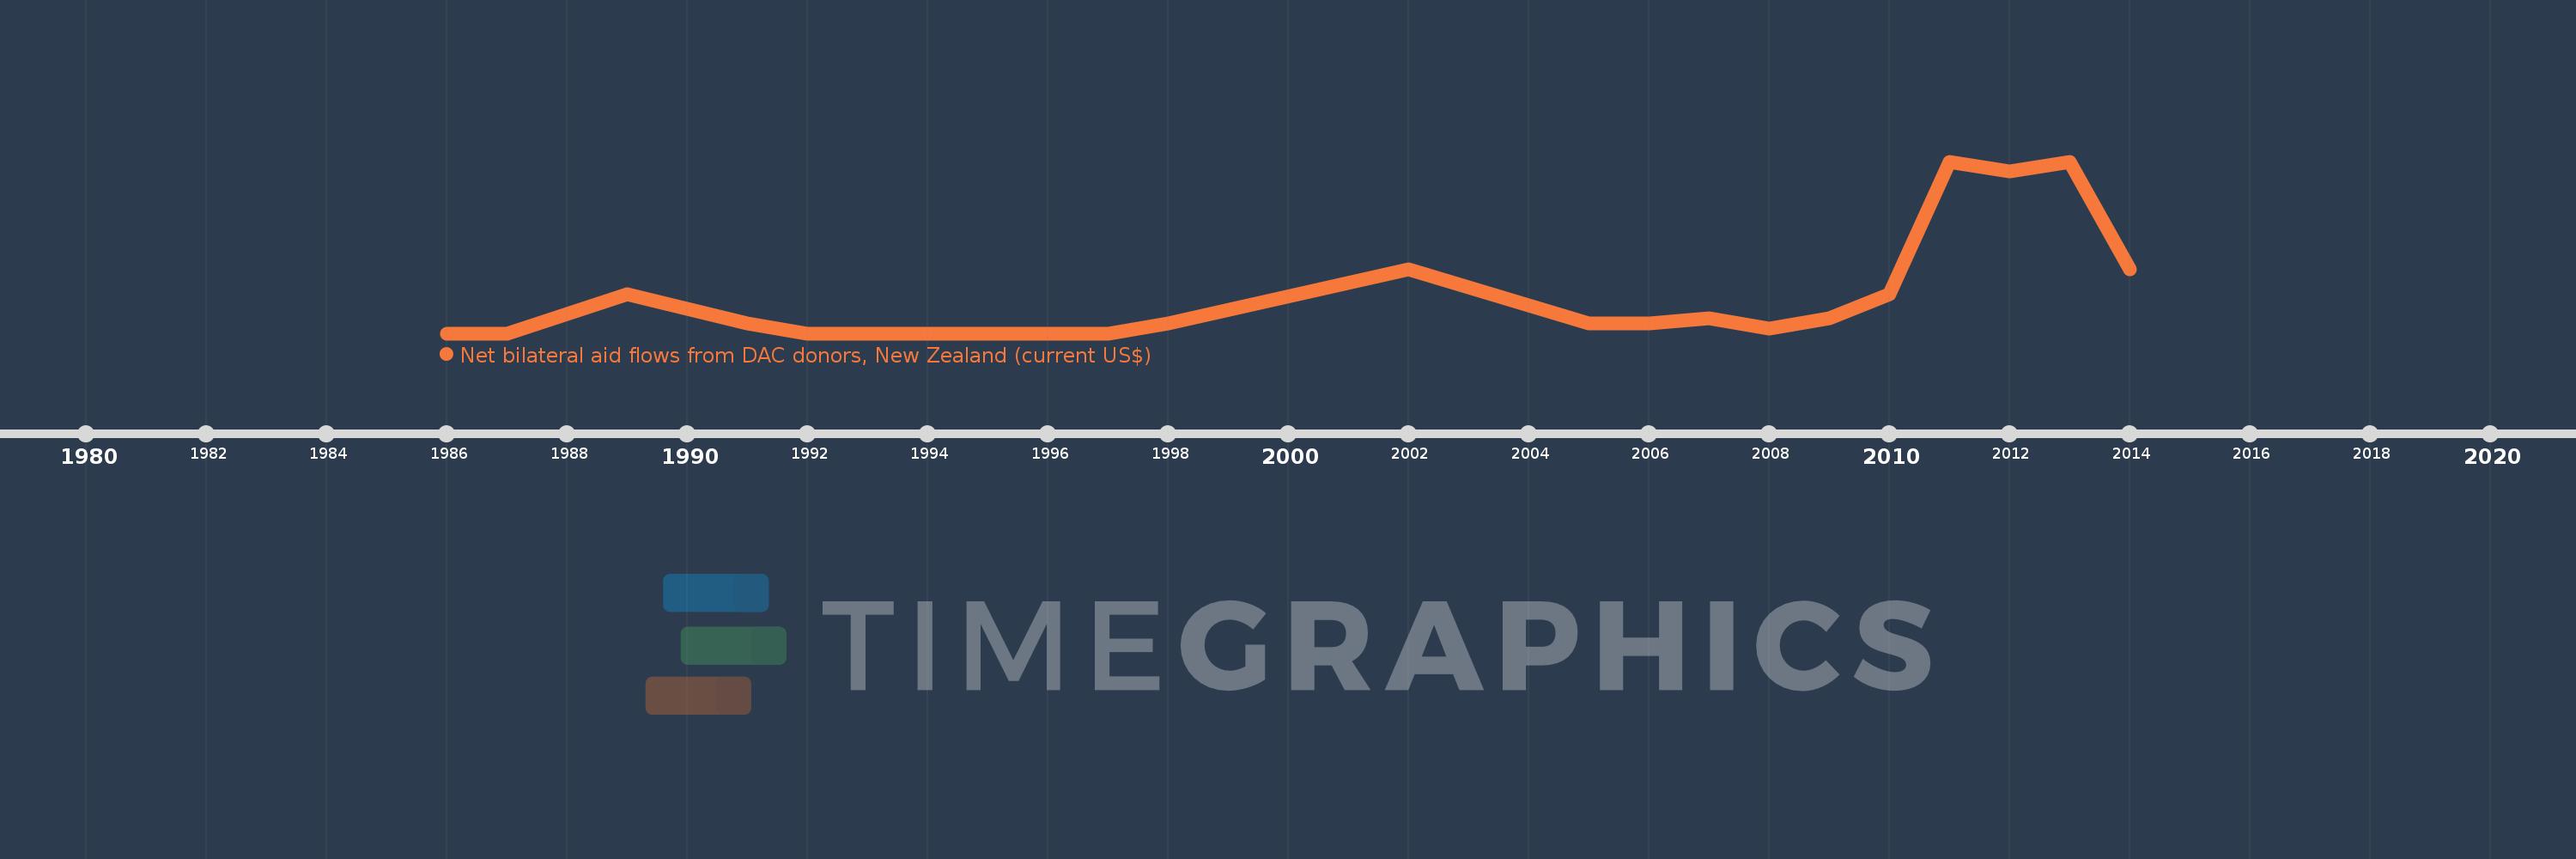
Net bilateral aid flows from DAC donors, New Zealand (current US$)
2014,2013,2012,2011,2010,2009,2008,2007,2006,2005,2002,1998,1997,1993,1992,1991,1990,1989,1988,1987,1986