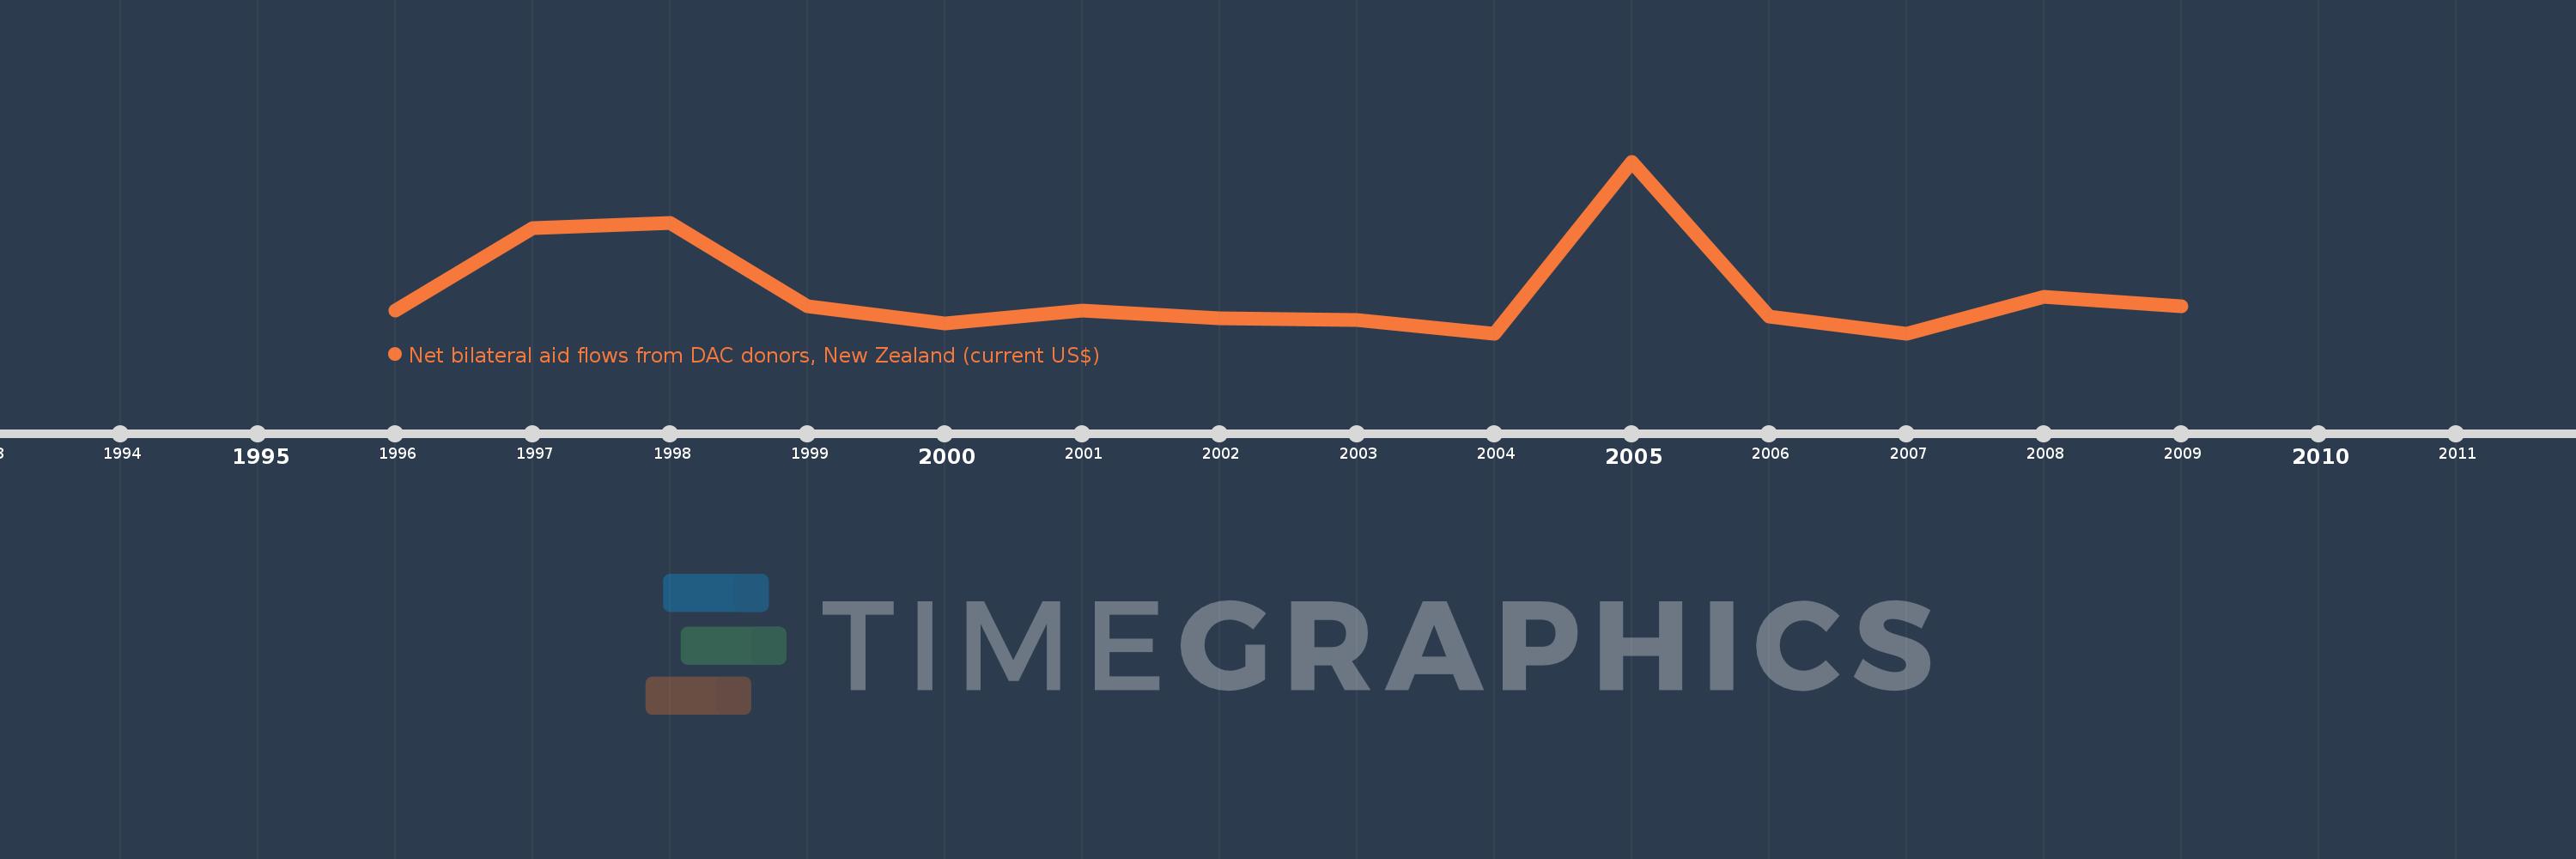
This timeline shows a graph from 1996 to 2009 of Korea, Dem. People’s Rep.. No data until 1995. Number of actual observations by date: 14.
Source name:
World Development Indicators
Source organization:
Development Assistance Committee of the Organisation for Economic Co-operation and Development, Geographical Distribution of Financial Flows to Developing Countries, Development Co-operation Report, and International Development Statistics database. Data are available online at: www.oecd.org/dac/stats/idsonline.
Categories, topics:
Aid Effectiveness
Last updated:
apr 23, 2017
Indicators value changes by year
Meaning:
426.429K
Minimum:
210.0K
jan 1, 2004
Maximum:
1.11 mln
jan 1, 2005
At the date of observation
Value
Absolute change
Change from the previous value
jan 1, 1996
330.0K
+330.0K
0.0%
jan 1, 1997
760.0K
+430.0K
130.3%
jan 1, 1998
790.0K
+30.0K
3.95%
jan 1, 1999
350.0K
-440.0K
-55.7%
jan 1, 2000
260.0K
-90.0K
-25.71%
jan 1, 2001
330.0K
+70.0K
26.92%
jan 1, 2002
290.0K
-40.0K
-12.12%
jan 1, 2003
280.0K
-10.0K
-3.45%
jan 1, 2004
210.0K
-70.0K
-25.0%
jan 1, 2005
1.11 mln
+900.0K
428.57%
jan 1, 2006
300.0K
-810.0K
-72.97%
jan 1, 2007
210.0K
-90.0K
-30.0%
jan 1, 2008
400.0K
+190.0K
90.48%
jan 1, 2009
350.0K
-50.0K
-12.5%
Ranking of countries by current statistics by years