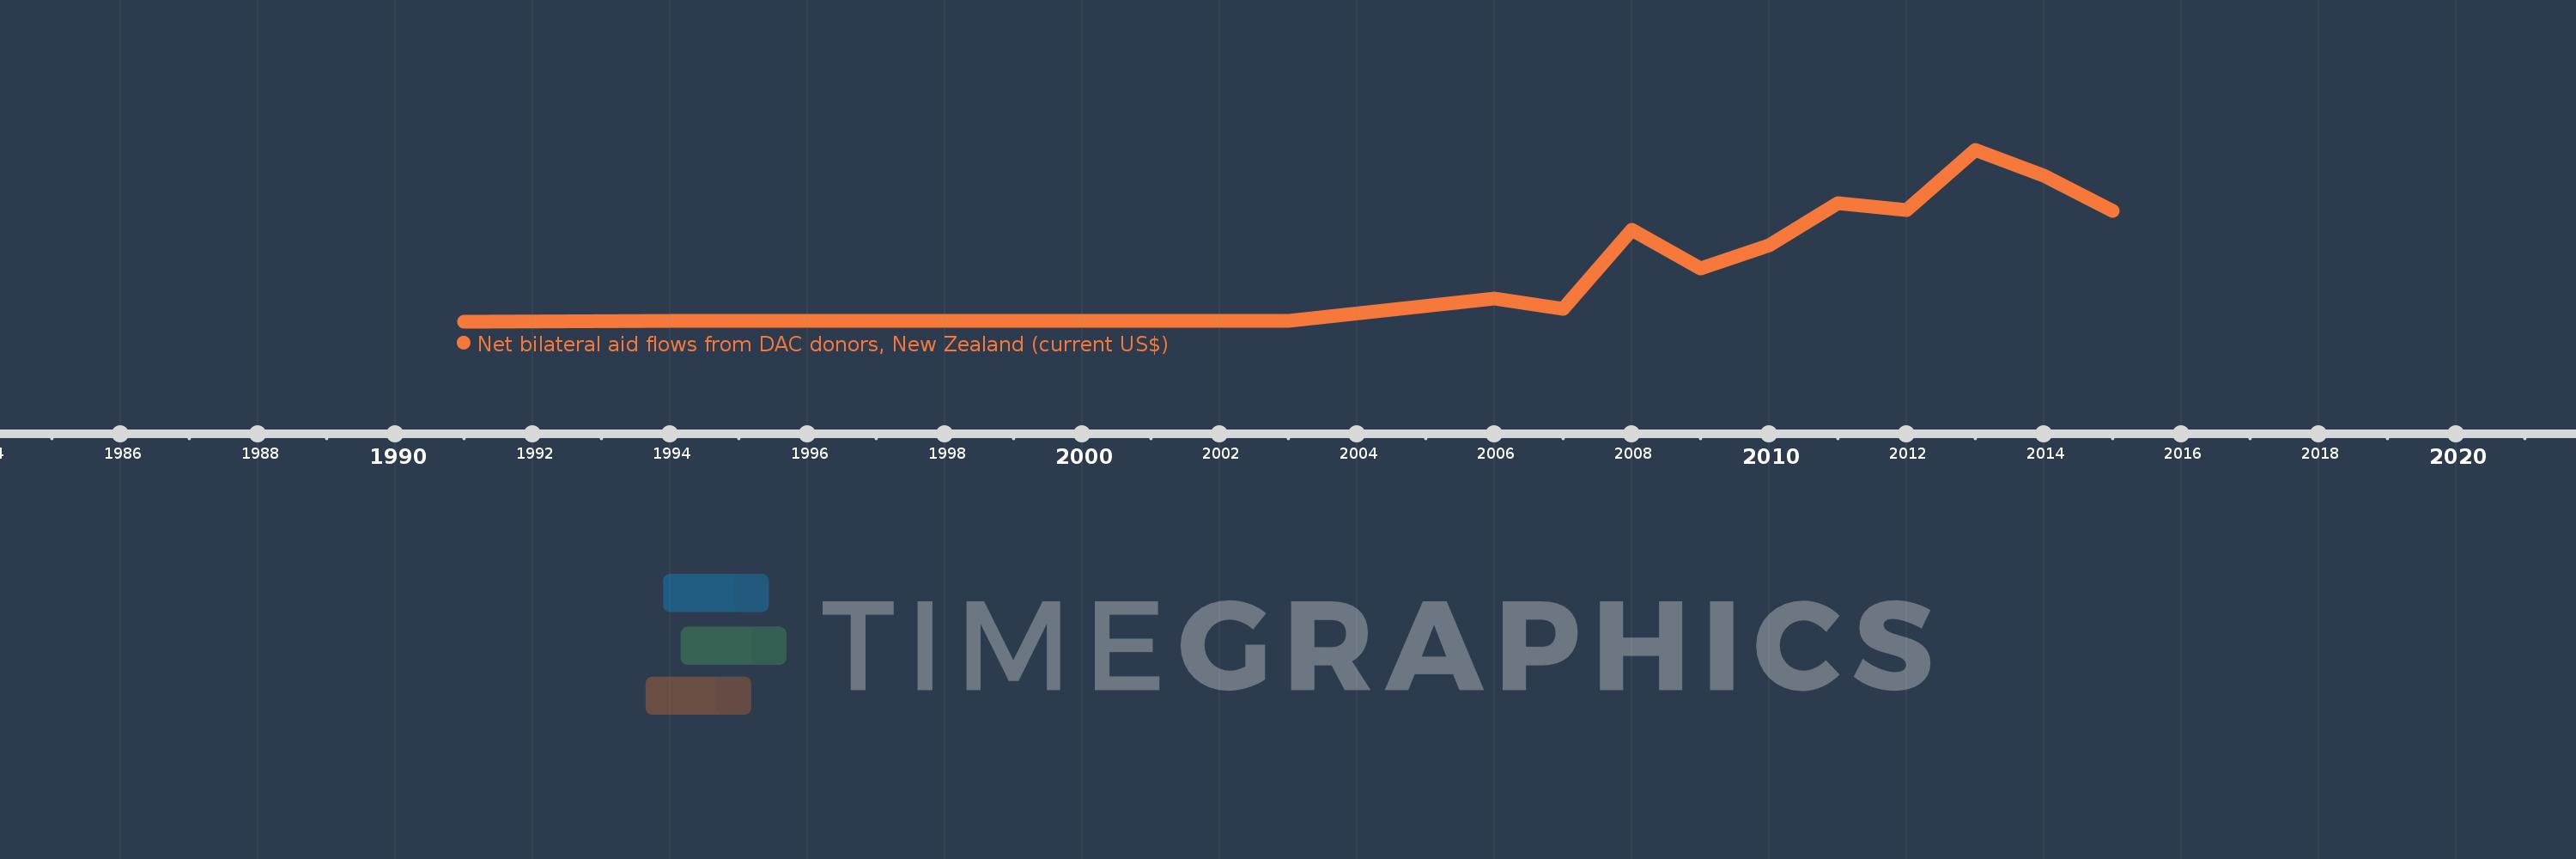
This timeline shows a graph from 1991 to 2015 of Nauru. No data until 1990. Number of actual observations by date: 15.
Source name:
World Development Indicators
Source organization:
Development Assistance Committee of the Organisation for Economic Co-operation and Development, Geographical Distribution of Financial Flows to Developing Countries, Development Co-operation Report, and International Development Statistics database. Data are available online at: www.oecd.org/dac/stats/idsonline.
Categories, topics:
Aid Effectiveness
Last updated:
apr 23, 2017
Indicators value changes by year
Meaning:
888.667K
Minimum:
10.0K
jan 1, 1991
Maximum:
2.46 mln
jan 1, 2013
At the date of observation
Value
Absolute change
Change from the previous value
jan 1, 1991
10.0K
+10.0K
0.0%
jan 1, 1994
20.0K
+10.0K
100.0%
jan 1, 1996
30.0K
+10.0K
50.0%
jan 1, 1997
20.0K
-10.0K
-33.33%
jan 1, 2003
20.0K
0.0
0.0%
jan 1, 2006
350.0K
+330.0K
1.65K%
jan 1, 2007
200.0K
-150.0K
-42.86%
jan 1, 2008
1.33 mln
+1.13 mln
565.0%
jan 1, 2009
770.0K
-560.0K
-42.11%
jan 1, 2010
1.11 mln
+340.0K
44.16%
jan 1, 2011
1.7 mln
+590.0K
53.15%
jan 1, 2012
1.61 mln
-90.0K
-5.29%
jan 1, 2013
2.46 mln
+850.0K
52.8%
jan 1, 2014
2.1 mln
-360.0K
-14.63%
jan 1, 2015
1.6 mln
-500.0K
-23.81%
Ranking of countries by current statistics by years