33
/
AIzaSyB4mHJ5NPEv-XzF7P6NDYXjlkCWaeKw5bc
November 30, 2025
125150
Egypt, Arab Rep.
EGY
true
2
1
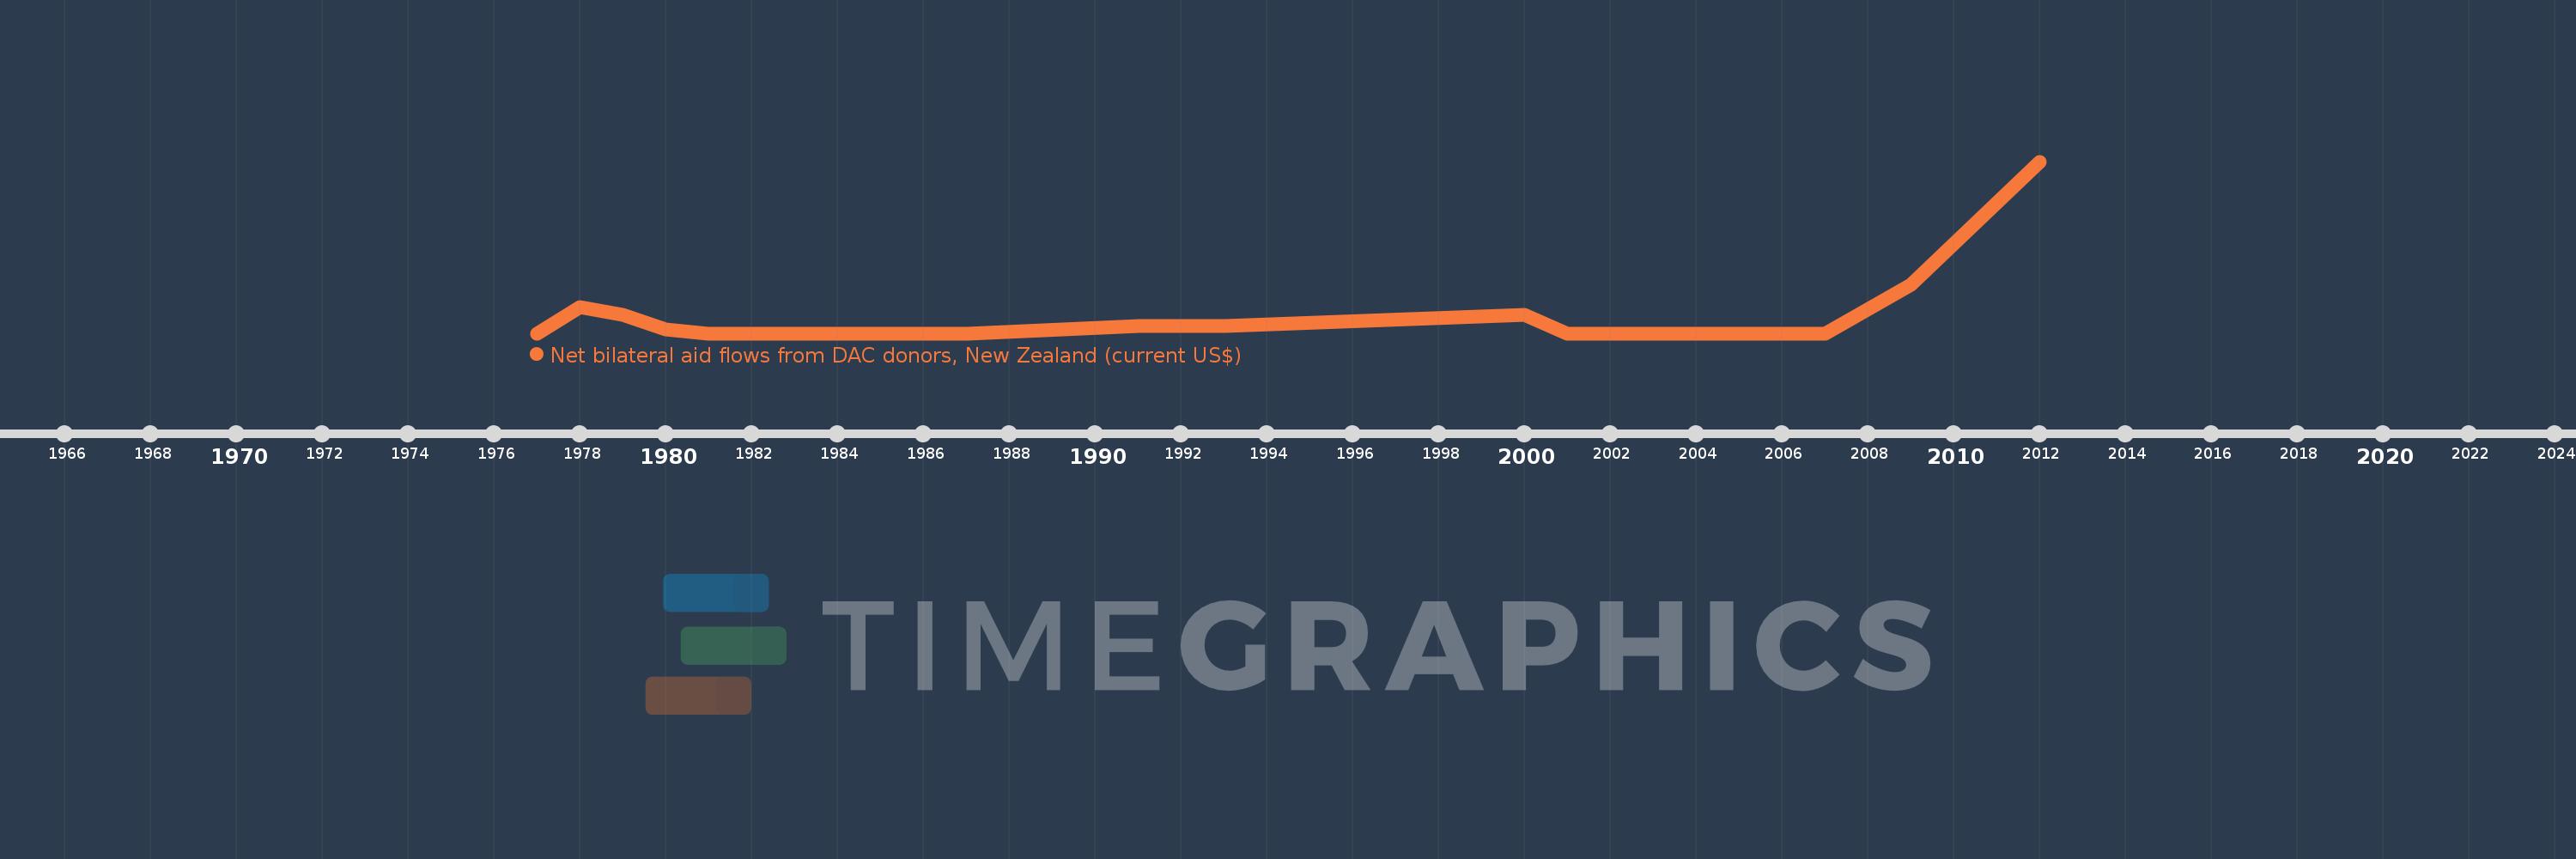
Net bilateral aid flows from DAC donors, New Zealand (current US$)
2012,2009,2007,2006,2005,2004,2003,2002,2001,2000,1993,1991,1987,1983,1982,1981,1980,1979,1978,1977