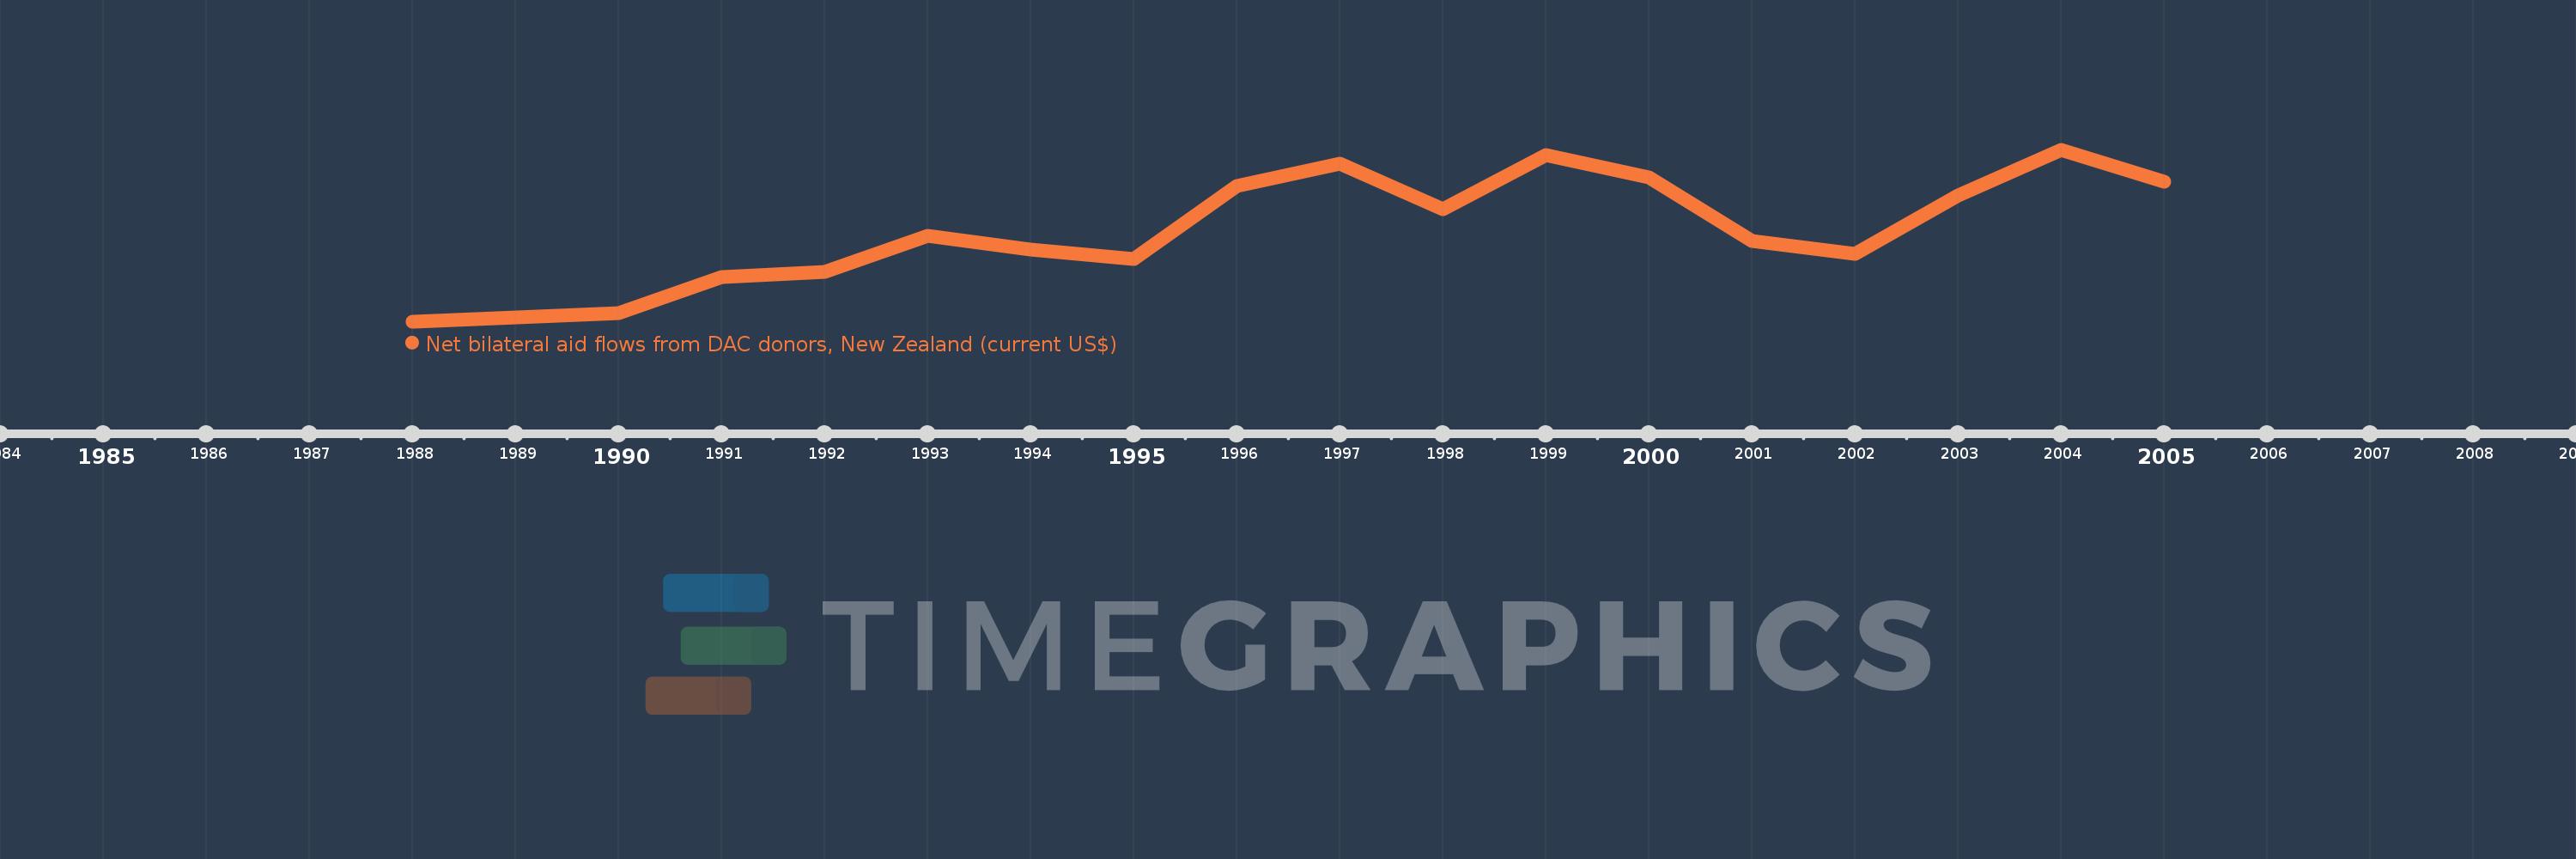
This timeline shows a graph from 1988 to 2005 of New Caledonia. No data until 1987. Number of actual observations by date: 18.
Source name:
World Development Indicators
Source organization:
Development Assistance Committee of the Organisation for Economic Co-operation and Development, Geographical Distribution of Financial Flows to Developing Countries, Development Co-operation Report, and International Development Statistics database. Data are available online at: www.oecd.org/dac/stats/idsonline.
Categories, topics:
Aid Effectiveness
Last updated:
apr 23, 2017
Indicators value changes by year
Meaning:
211.111K
Minimum:
10.0K
jan 1, 1988
Maximum:
390.0K
jan 1, 2004
At the date of observation
Value
Absolute change
Change from the previous value
jan 1, 1988
10.0K
+10.0K
0.0%
jan 1, 1989
20.0K
+10.0K
100.0%
jan 1, 1990
30.0K
+10.0K
50.0%
jan 1, 1991
110.0K
+80.0K
266.67%
jan 1, 1992
120.0K
+10.0K
9.09%
jan 1, 1993
200.0K
+80.0K
66.67%
jan 1, 1994
170.0K
-30.0K
-15.0%
jan 1, 1995
150.0K
-20.0K
-11.76%
jan 1, 1996
310.0K
+160.0K
106.67%
jan 1, 1997
360.0K
+50.0K
16.13%
jan 1, 1998
260.0K
-100.0K
-27.78%
jan 1, 1999
380.0K
+120.0K
46.15%
jan 1, 2000
330.0K
-50.0K
-13.16%
jan 1, 2001
190.0K
-140.0K
-42.42%
jan 1, 2002
160.0K
-30.0K
-15.79%
jan 1, 2003
290.0K
+130.0K
81.25%
jan 1, 2004
390.0K
+100.0K
34.48%
jan 1, 2005
320.0K
-70.0K
-17.95%
Ranking of countries by current statistics by years