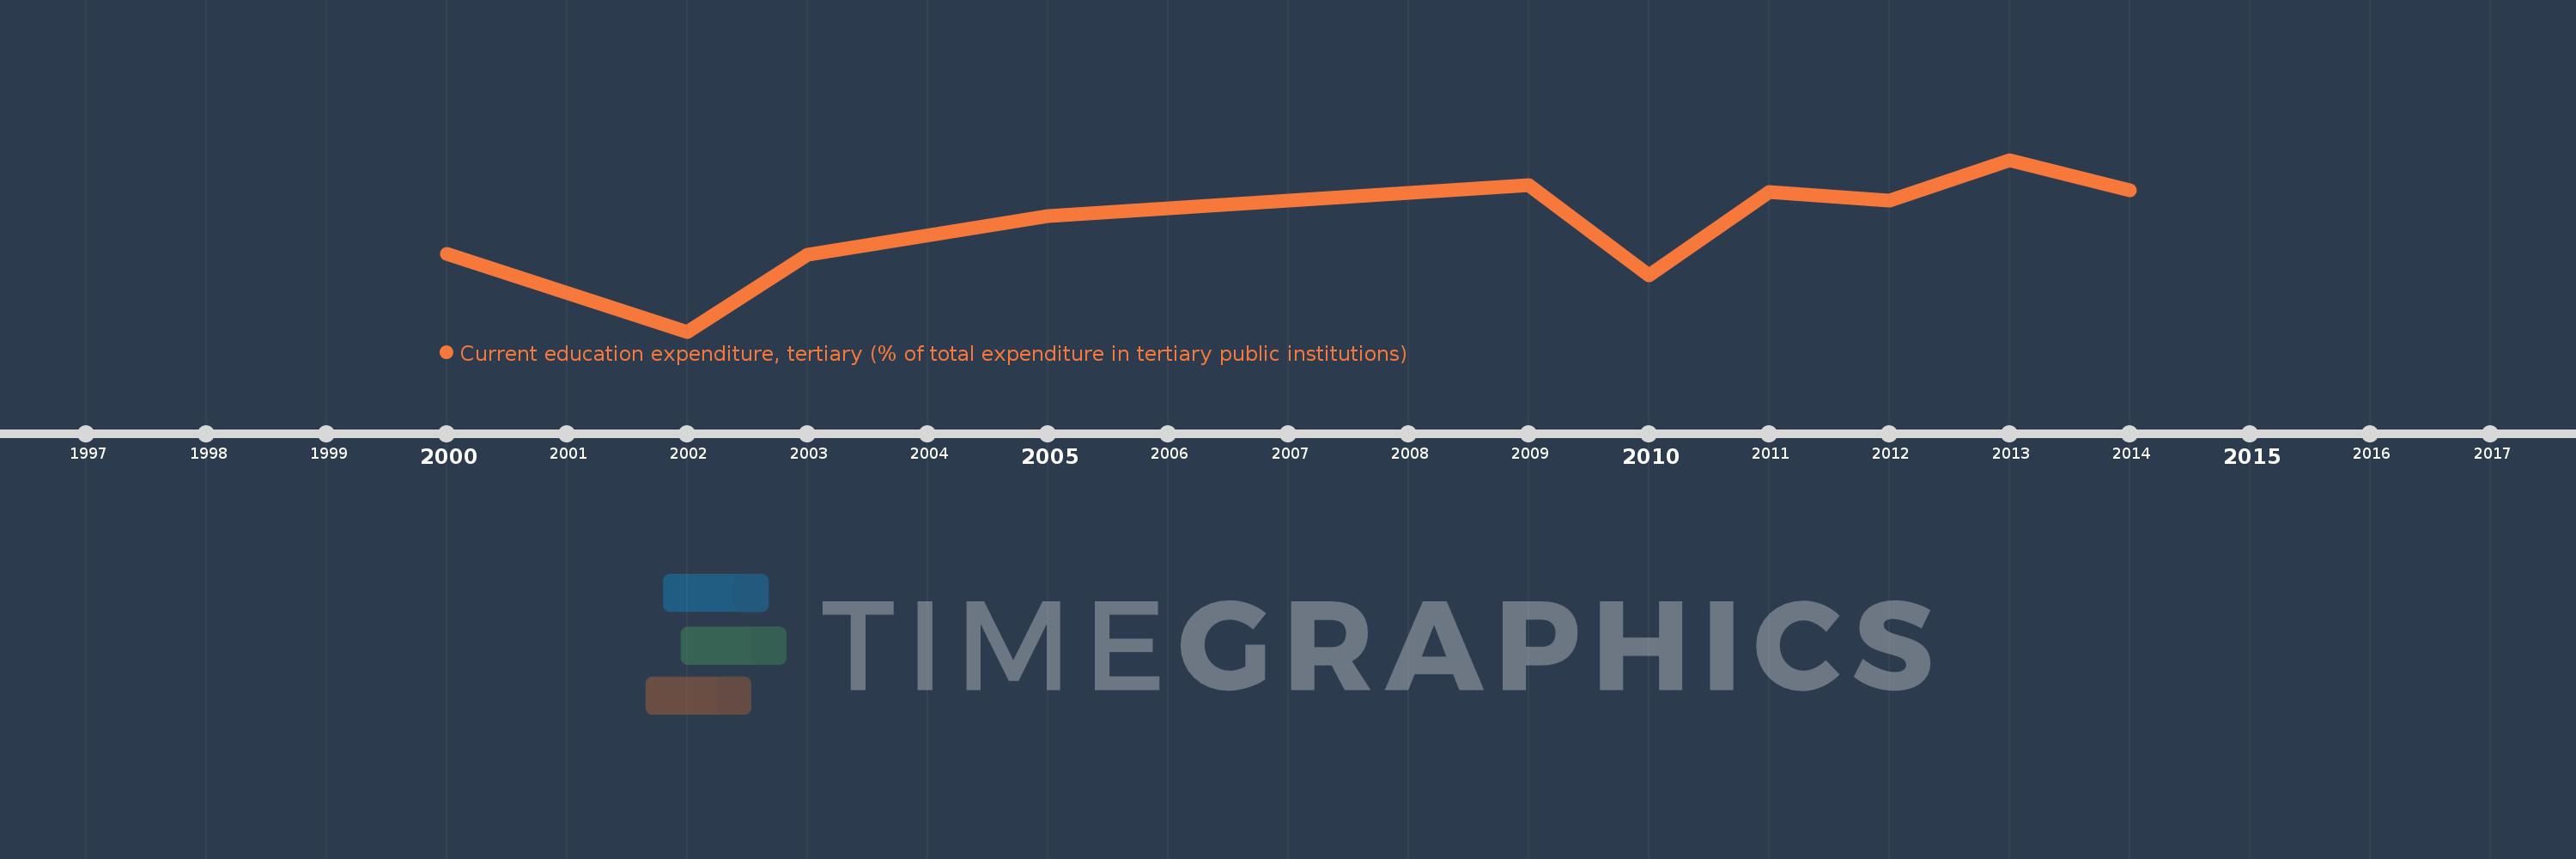
Questa scala temporale mostra un grafico dal 2000 anno al 2014 anno. Burundi. I dati fino ad 1999 anno non disponibili. Il numero di osservazioni attuali secondo i date: 10.
La fonte (nome):
Indicatori dello sviluppo mondiale
La fonte (organizzazione):
United Nations Educational, Scientific, and Cultural Organization (UNESCO) Institute for Statistics.
Categorie:
Education
sono stati aggiornati
23 apr 2017 anni
Indicatori delle variazioni dei valori per anni
In media:
95.438
Minima:
90.192
1 gen 2002 anni
Massimo:
98.726
1 gen 2013 anni
Alla data di osservazione
Valore
Variazione assoluta
La variazione rispetto al valore precedente
1 gen 2000 anni
94.051
+94.051
0.0%
1 gen 2002 anni
90.192
-3.859
-4.1%
1 gen 2003 anni
94.028
+3.836
4.25%
1 gen 2005 anni
95.91
+1.882
2.0%
1 gen 2009 anni
97.46
+1.55
1.62%
1 gen 2010 anni
92.985
-4.475
-4.59%
1 gen 2011 anni
97.12
+4.135
4.45%
1 gen 2012 anni
96.713
-0.407
-0.42%
1 gen 2013 anni
98.726
+2.013
2.08%
1 gen 2014 anni
97.191
-1.535
-1.56%
Classificazione dei paesi secondo i statistiche attuali per anni