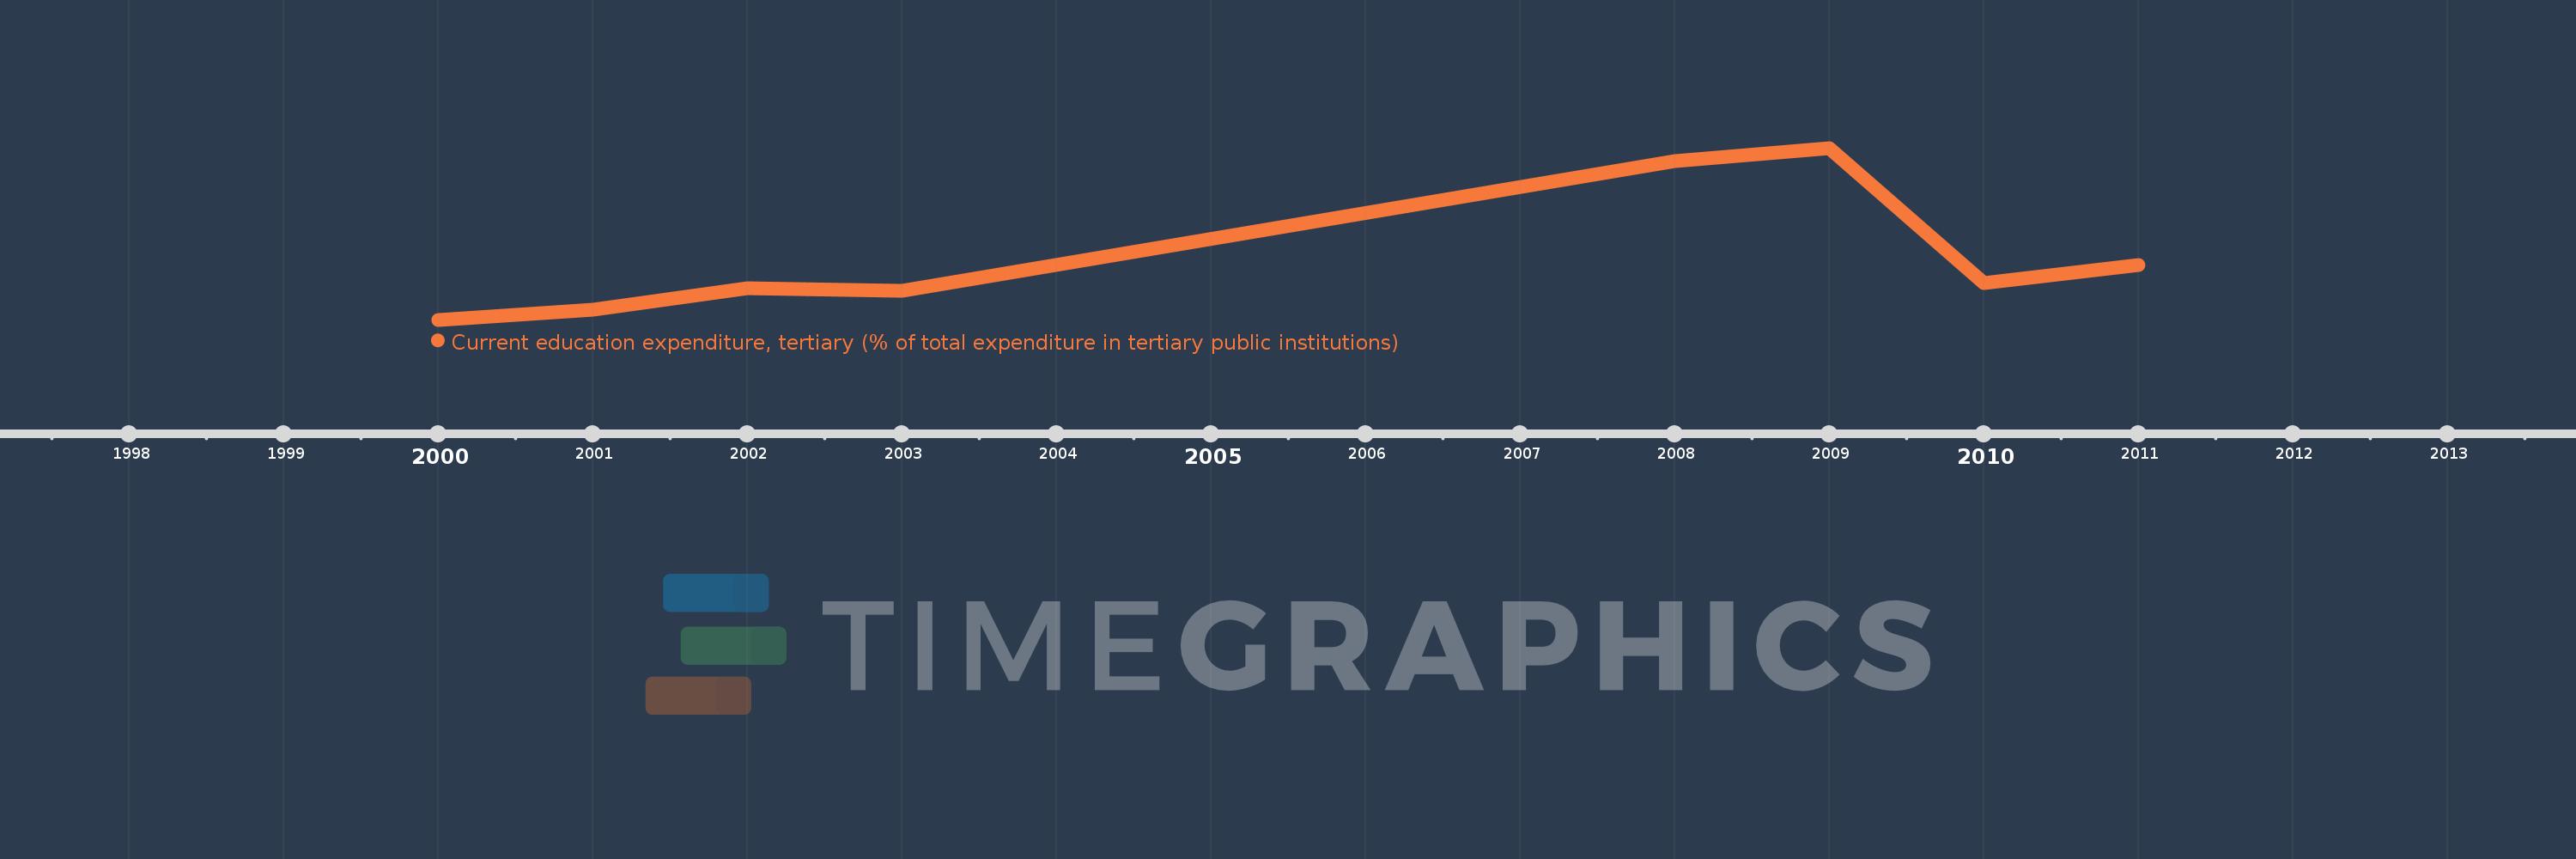
Questa scala temporale mostra un grafico dal 2000 anno al 2011 anno. Tunisia. I dati fino ad 1999 anno non disponibili. Il numero di osservazioni attuali secondo i date: 8.
La fonte (nome):
Indicatori dello sviluppo mondiale
La fonte (organizzazione):
United Nations Educational, Scientific, and Cultural Organization (UNESCO) Institute for Statistics.
Categorie:
Education
sono stati aggiornati
23 apr 2017 anni
Indicatori delle variazioni dei valori per anni
In media:
76.779
Minima:
73.641
1 gen 2000 anni
Massimo:
82.414
1 gen 2009 anni
Alla data di osservazione
Valore
Variazione assoluta
La variazione rispetto al valore precedente
1 gen 2000 anni
73.641
+73.641
0.0%
1 gen 2001 anni
74.146
+0.505
0.69%
1 gen 2002 anni
75.23
+1.084
1.46%
1 gen 2003 anni
75.115
-0.115
-0.15%
1 gen 2008 anni
81.744
+6.628
8.82%
1 gen 2009 anni
82.414
+0.67
0.82%
1 gen 2010 anni
75.523
-6.891
-8.36%
1 gen 2011 anni
76.418
+0.895
1.18%
Classificazione dei paesi secondo i statistiche attuali per anni