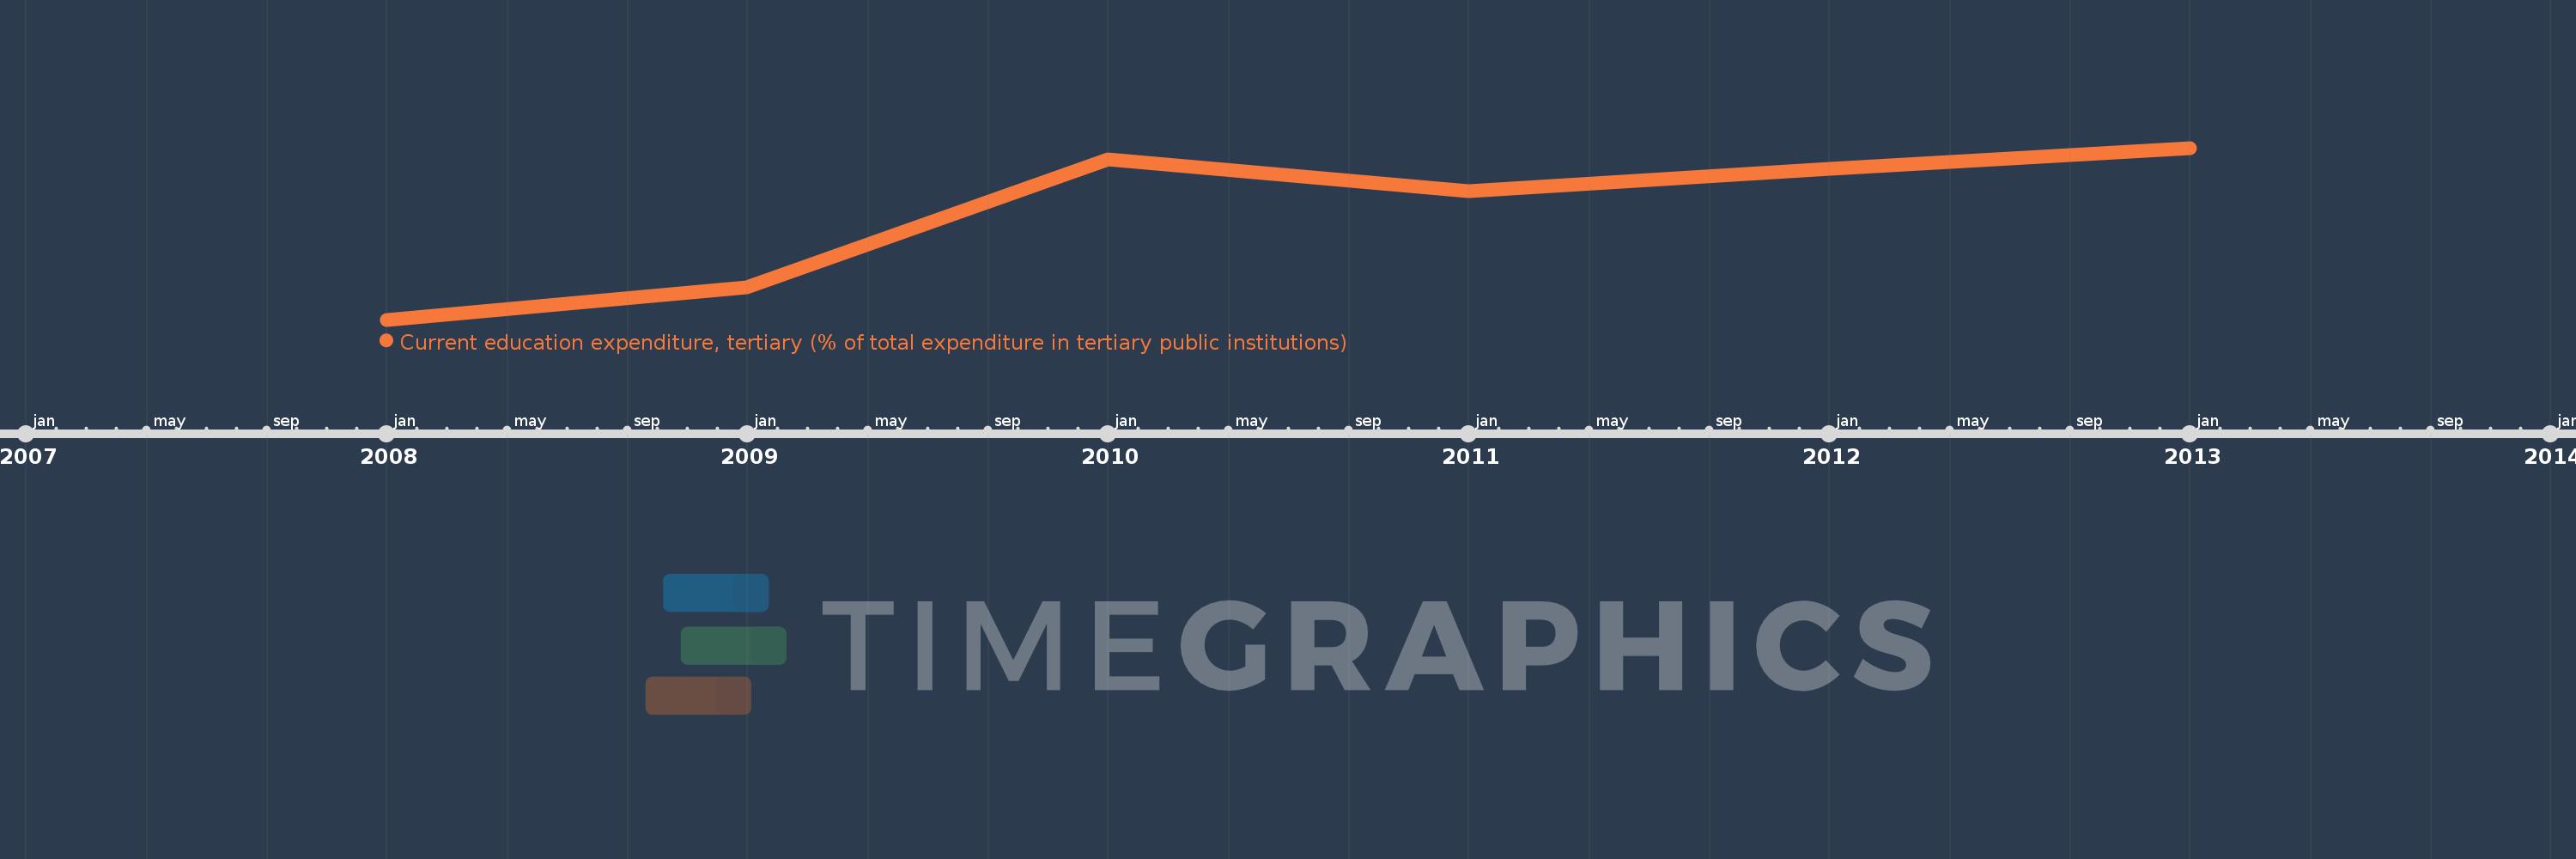
Questa scala temporale mostra un grafico dal 2008 anno al 2013 anno. Serbia. I dati fino ad 2007 anno non disponibili. Il numero di osservazioni attuali secondo i date: 6.
La fonte (nome):
Indicatori dello sviluppo mondiale
La fonte (organizzazione):
United Nations Educational, Scientific, and Cultural Organization (UNESCO) Institute for Statistics.
Categorie:
Education
sono stati aggiornati
23 apr 2017 anni
Indicatori delle variazioni dei valori per anni
In media:
95.82
Minima:
94.341
1 gen 2008 anni
Massimo:
96.708
1 gen 2013 anni
Alla data di osservazione
Valore
Variazione assoluta
La variazione rispetto al valore precedente
1 gen 2008 anni
94.341
+94.341
0.0%
1 gen 2009 anni
94.786
+0.445
0.47%
1 gen 2010 anni
96.553
+1.766
1.86%
1 gen 2011 anni
96.116
-0.436
-0.45%
1 gen 2012 anni
96.415
+0.299
0.31%
1 gen 2013 anni
96.708
+0.292
0.3%
Classificazione dei paesi secondo i statistiche attuali per anni