Download Queste statistiche in altri paesi:
Linea del tempo:
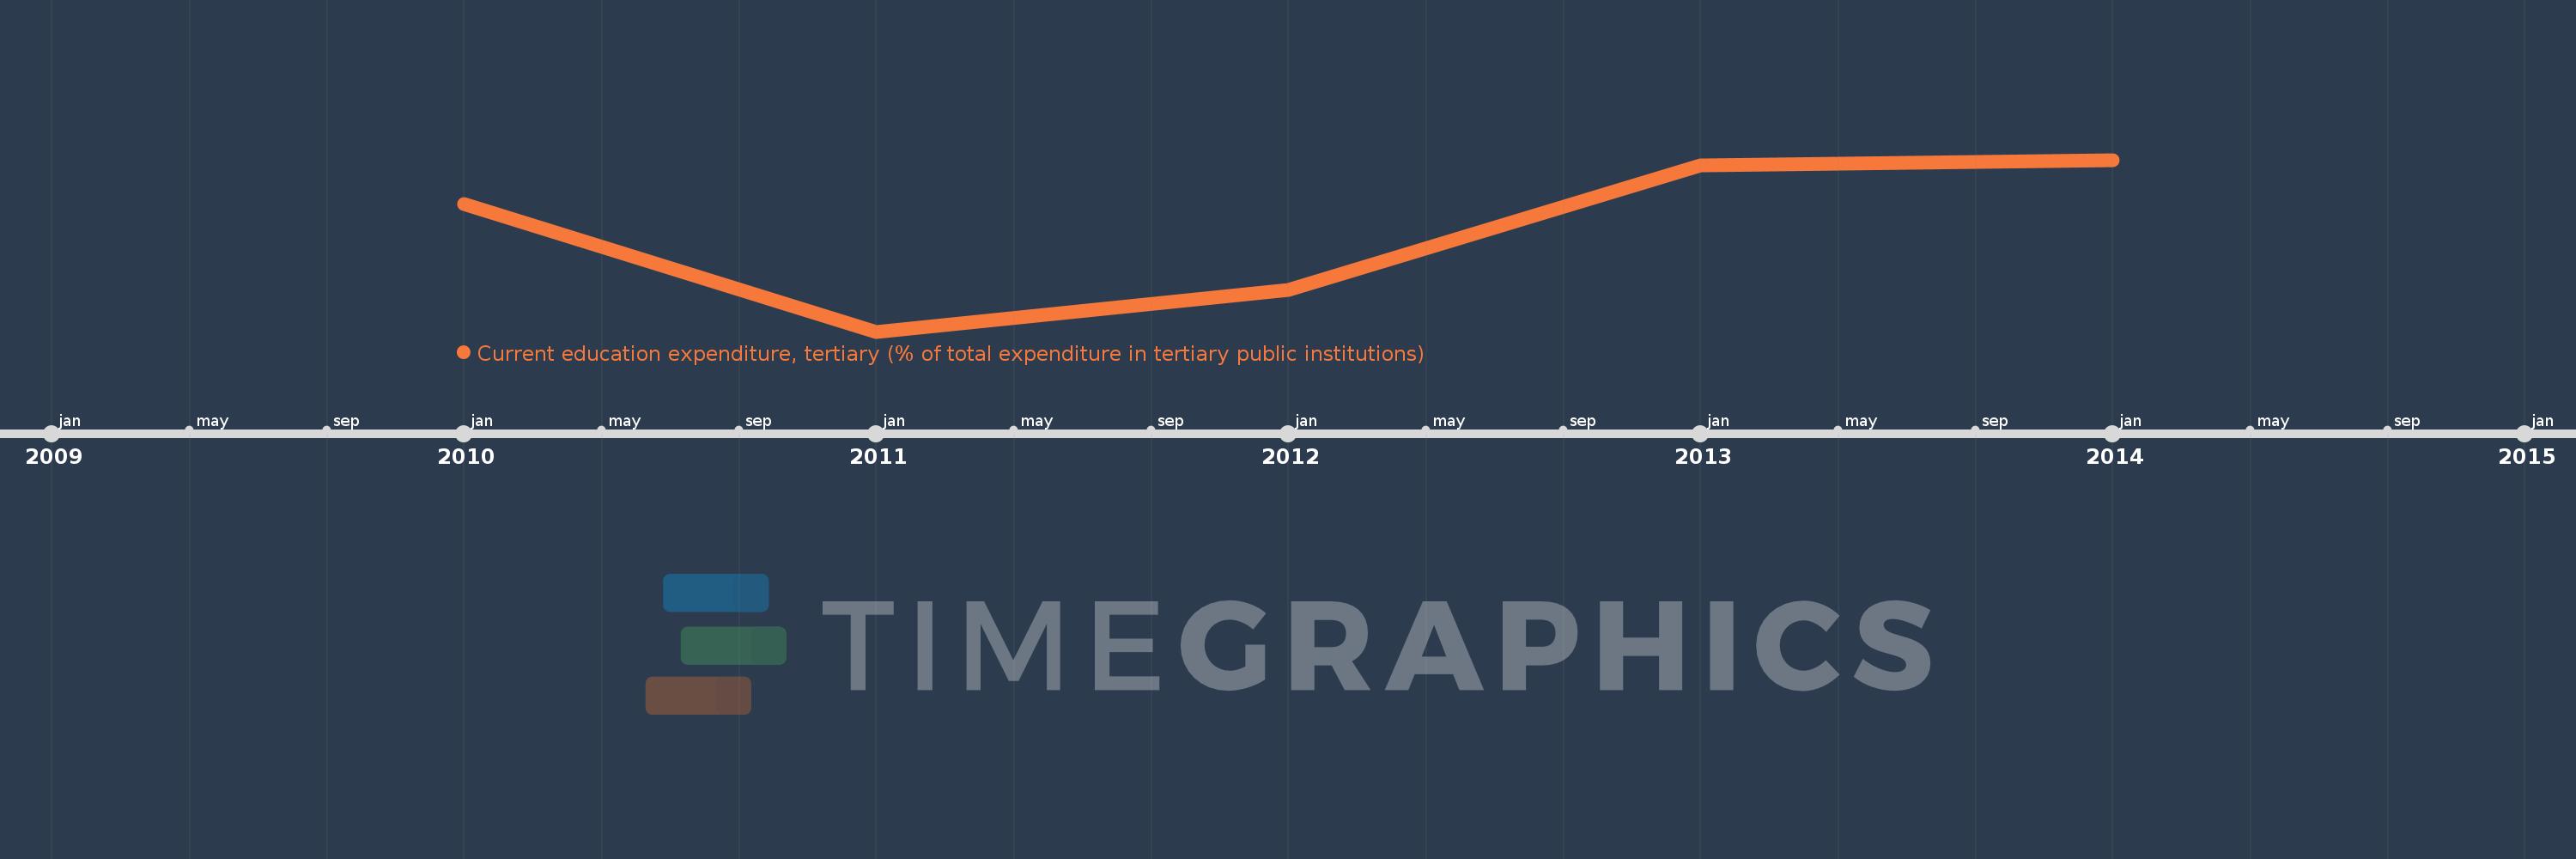
Questa scala temporale mostra un grafico dal 2010 anno al 2014 anno. Ethiopia. I dati fino ad 2009 anno non disponibili. Il numero di osservazioni attuali secondo i date: 5.
La fonte (nome):
Indicatori dello sviluppo mondiale
La fonte (organizzazione):
United Nations Educational, Scientific, and Cultural Organization (UNESCO) Institute for Statistics.
Categorie:
Education
sono stati aggiornati
23 apr 2017 anni
Indicatori delle variazioni dei valori per anni
Minima:
42.917
1 gen 2011 anni
Massimo:
47.948
1 gen 2014 anni
Alla data di osservazione
Valore
Variazione assoluta
La variazione rispetto al valore precedente
1 gen 2010 anni
46.663
+46.663
0.0%
1 gen 2011 anni
42.917
-3.747
-8.03%
1 gen 2012 anni
44.132
+1.215
2.83%
1 gen 2013 anni
47.797
+3.665
8.31%
1 gen 2014 anni
47.948
+0.151
0.32%
Classificazione dei paesi secondo i statistiche attuali per anni