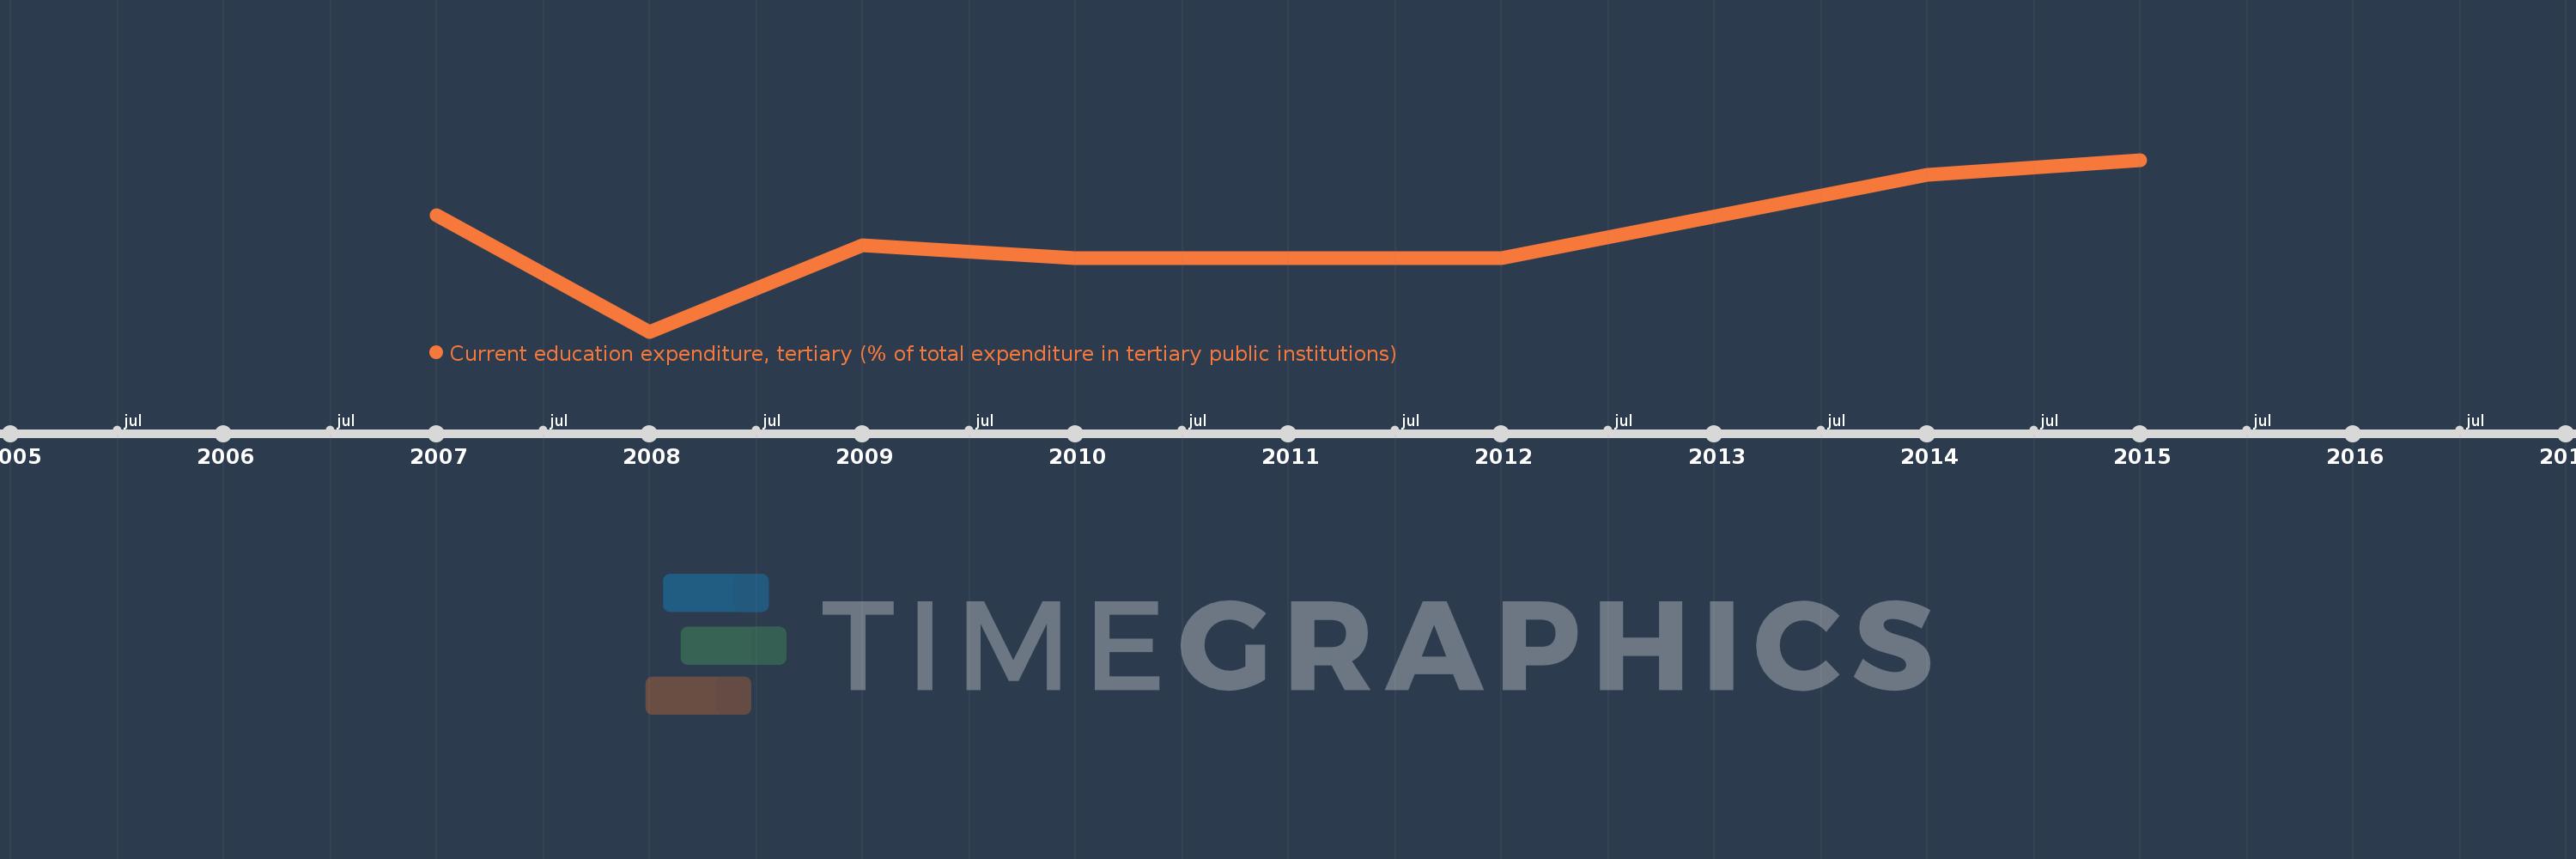
Questa scala temporale mostra un grafico dal 2007 anno al 2015 anno. Andorra. I dati fino ad 2006 anno non disponibili. Il numero di osservazioni attuali secondo i date: 8.
La fonte (nome):
Indicatori dello sviluppo mondiale
La fonte (organizzazione):
United Nations Educational, Scientific, and Cultural Organization (UNESCO) Institute for Statistics.
Categorie:
Education
sono stati aggiornati
23 apr 2017 anni
Indicatori delle variazioni dei valori per anni
In media:
95.568
Minima:
90.844
1 gen 2008 anni
Massimo:
99.473
1 gen 2015 anni
Alla data di osservazione
Valore
Variazione assoluta
La variazione rispetto al valore precedente
1 gen 2007 anni
96.696
+96.696
0.0%
1 gen 2008 anni
90.844
-5.852
-6.05%
1 gen 2009 anni
95.161
+4.317
4.75%
1 gen 2010 anni
94.55
-0.611
-0.64%
1 gen 2011 anni
94.55
0.0
0.0%
1 gen 2012 anni
94.55
0.0
0.0%
1 gen 2014 anni
98.72
+4.17
4.41%
1 gen 2015 anni
99.473
+0.752
0.76%
Classificazione dei paesi secondo i statistiche attuali per anni