30
/it/
AIzaSyAYiBZKx7MnpbEhh9jyipgxe19OcubqV5w
April 1, 2024
35631
High income
HIC
false
2
1
Current education expenditure, tertiary (% of total expenditure in tertiary public institutions)
2012,2011,2010,2009,2008,2007,2006,2005,2004,2003,2002,2001,2000
Download
Biblioteca di statistiche globali →High income →

Current education expenditure, tertiary (% of total expenditure in tertiary public institutions)

Queste statistiche in altri paesi:

AlbaniaAmerican SamoaAndorraAngolaAntigua and BarbudaArgentinaArmeniaArubaAustraliaAustriaAzerbaijanBangladeshBarbadosBelarusBelgiumBelizeBeninBermudaBoliviaBotswanaBrazilBritish Virgin IslandsBulgariaBurkina FasoBurundiCabo VerdeCameroonCanadaCaribbean small statesCentral African RepublicCentral Europe and the BalticsChadChileChinaColombiaComorosCongo, Dem. Rep.Congo, Rep.Cote d'IvoireCroatiaCubaCuracaoCyprusCzech RepublicDenmarkDominican RepublicEcuadorEl SalvadorEritreaEstoniaEthiopiaEuro areaEurope & Central AsiaEurope & Central Asia (excluding high income)Europe & Central Asia (IDA & IBRD countries)European UnionFinlandFranceGambia, TheGermanyGhanaGreeceGrenadaGuatemalaGuineaGuinea-BissauGuyanaHeavily indebted poor countries (HIPC)High incomeHondurasHong Kong SAR, ChinaHungaryIcelandIndiaIndonesiaIran, Islamic Rep.IrelandIsraelItalyJamaicaJapanJordanKazakhstanKorea, Rep.KuwaitKyrgyz RepublicLate-demographic dividendLatin America & Caribbean Latin America & Caribbean (excluding high income)Latin America & the Caribbean (IDA & IBRD countries)LatviaLebanonLesothoLithuaniaLow incomeMacao SAR, ChinaMacedonia, FYRMadagascarMalawiMalaysiaMaldivesMaliMaltaMauritiusMexicoMoldovaMongoliaMoroccoMozambiqueNamibiaNetherlandsNicaraguaNigerNorth AmericaNorwayOECD membersOmanPakistanPanamaParaguayPeruPhilippinesPolandPortugalPost-demographic dividendPuerto RicoRomaniaRussian FederationRwandaSenegalSerbiaSeychellesSierra LeoneSingaporeSlovak RepublicSloveniaSouth AfricaSpainSri LankaSt. Kitts and NevisSt. LuciaSt. Vincent and the GrenadinesSwedenSwitzerlandTajikistanThailandTimor-LesteTogoTunisiaTurkeyTurkmenistanTurks and Caicos IslandsUgandaUkraineUnited StatesUruguayVenezuela, RBVietnamWorldZambiaZimbabwe

Linea del tempo:

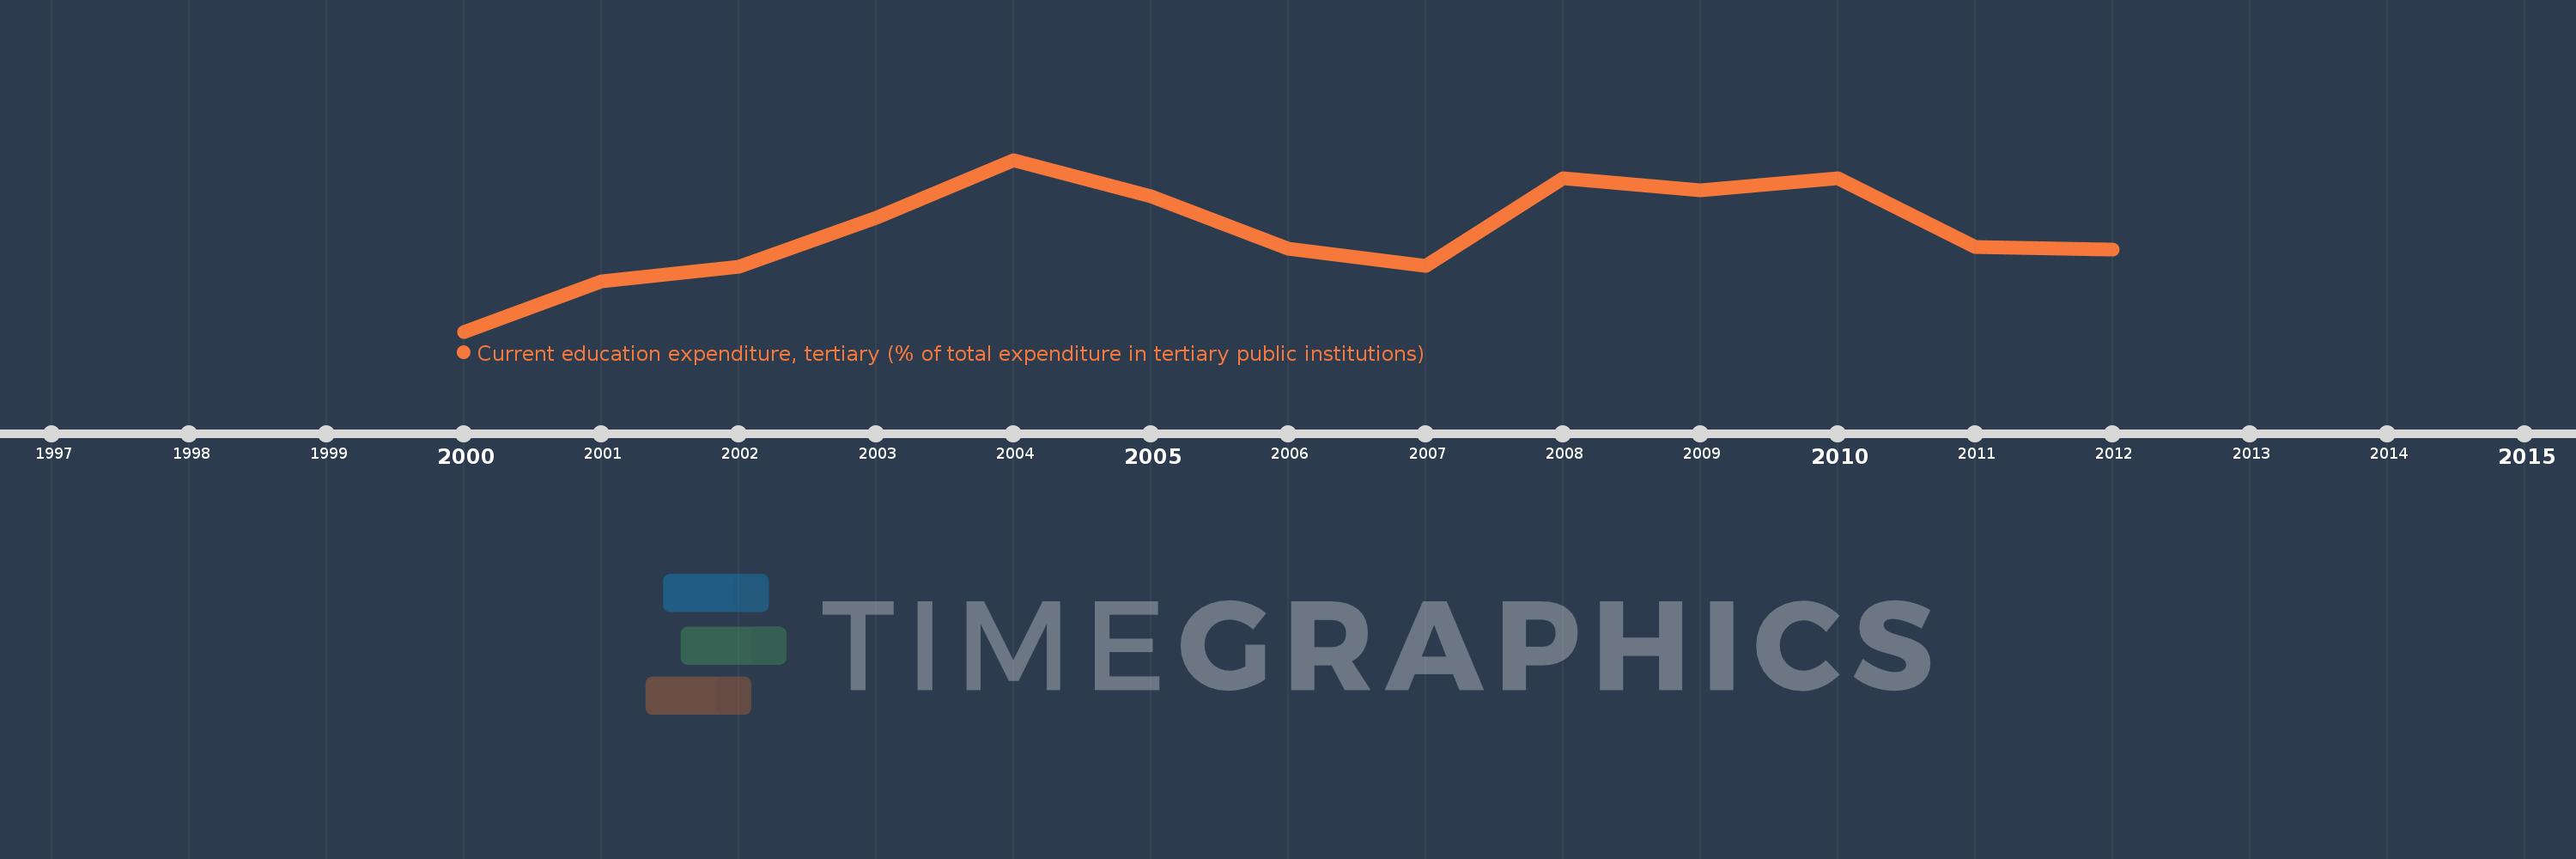
Questa scala temporale mostra un grafico dal 2000 anno al 2012 anno. High income. I dati fino ad 1999 anno non disponibili. Il numero di osservazioni attuali secondo i date: 13.

La fonte (nome):

Indicatori dello sviluppo mondiale

La fonte (organizzazione):

United Nations Educational, Scientific, and Cultural Organization (UNESCO) Institute for Statistics.

Categorie:

Education

sono stati aggiornati

23 apr 2017 anni

Indicatori delle variazioni dei valori per anni

In media:
89.94
Minima:
88.275
1 gen 2000 anni
Massimo:
91.135
1 gen 2004 anni
Alla data di osservazione
Valore
Variazione assoluta
La variazione rispetto al valore precedente
1 gen 2000 anni
88.275
+88.275
0.0%
1 gen 2001 anni
89.108
+0.834
0.94%
1 gen 2002 anni
89.361
+0.253
0.28%
1 gen 2003 anni
90.171
+0.81
0.91%
1 gen 2004 anni
91.135
+0.964
1.07%
1 gen 2005 anni
90.522
-0.614
-0.67%
1 gen 2006 anni
89.659
-0.862
-0.95%
1 gen 2007 anni
89.372
-0.288
-0.32%
1 gen 2008 anni
90.832
+1.46
1.63%
1 gen 2009 anni
90.628
-0.203
-0.22%
1 gen 2010 anni
90.823
+0.195
0.21%
1 gen 2011 anni
89.684
-1.139
-1.25%
1 gen 2012 anni
89.646
-0.038
-0.04%

Classificazione dei paesi secondo i statistiche attuali per anni