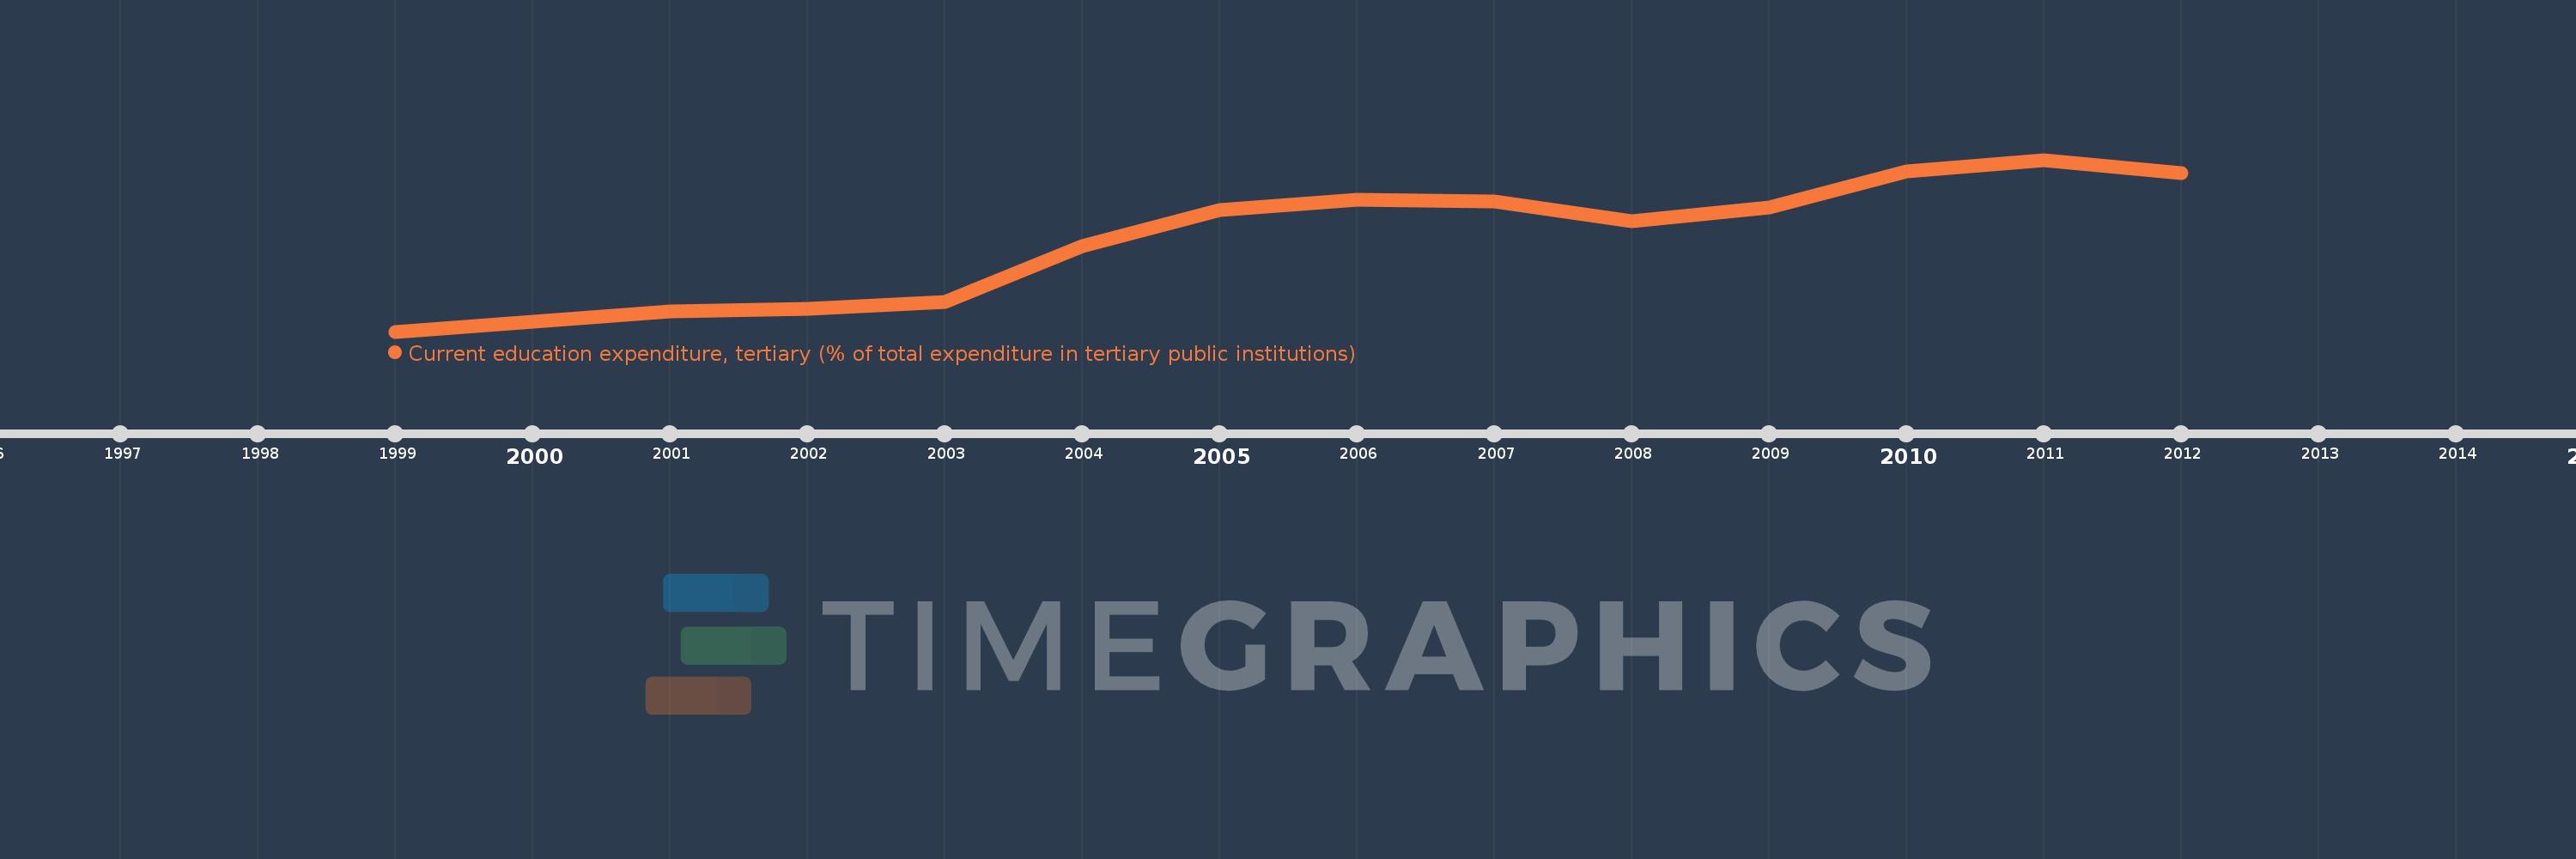
Questa scala temporale mostra un grafico dal 1999 anno al 2012 anno. Italy. I dati fino ad 1998 anno non disponibili. Il numero di osservazioni attuali secondo i date: 13.
La fonte (nome):
Indicatori dello sviluppo mondiale
La fonte (organizzazione):
United Nations Educational, Scientific, and Cultural Organization (UNESCO) Institute for Statistics.
Categorie:
Education
sono stati aggiornati
23 apr 2017 anni
Indicatori delle variazioni dei valori per anni
In media:
87.365
Minima:
81.689
1 gen 1999 anni
Massimo:
91.711
1 gen 2011 anni
Alla data di osservazione
Valore
Variazione assoluta
La variazione rispetto al valore precedente
1 gen 1999 anni
81.689
+81.689
0.0%
1 gen 2001 anni
82.849
+1.16
1.42%
1 gen 2002 anni
83.028
+0.179
0.22%
1 gen 2003 anni
83.397
+0.369
0.45%
1 gen 2004 anni
86.651
+3.254
3.9%
1 gen 2005 anni
88.77
+2.119
2.45%
1 gen 2006 anni
89.356
+0.585
0.66%
1 gen 2007 anni
89.269
-0.087
-0.1%
1 gen 2008 anni
88.147
-1.122
-1.26%
1 gen 2009 anni
88.932
+0.785
0.89%
1 gen 2010 anni
91.028
+2.096
2.36%
1 gen 2011 anni
91.711
+0.683
0.75%
1 gen 2012 anni
90.915
-0.796
-0.87%
Classificazione dei paesi secondo i statistiche attuali per anni