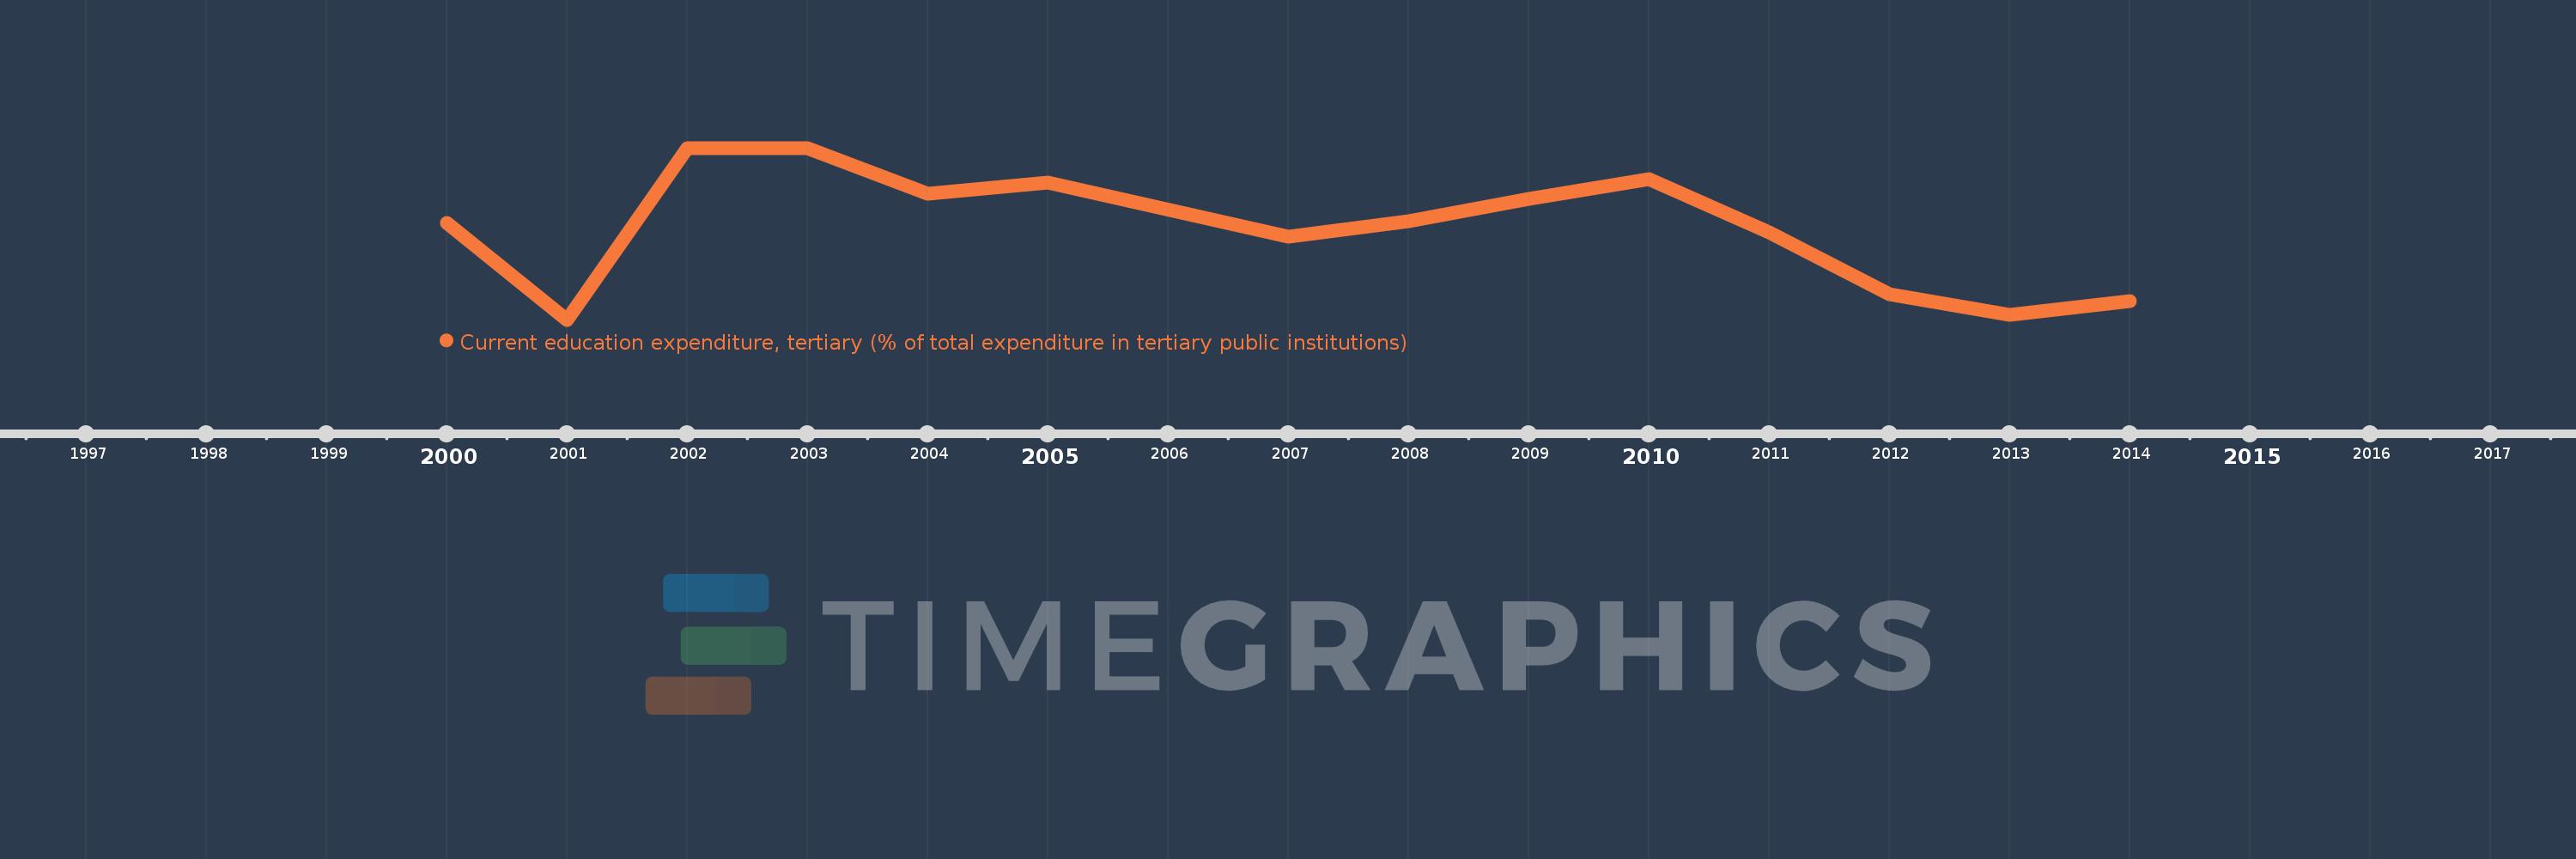
Questa scala temporale mostra un grafico dal 2000 anno al 2014 anno. Latvia. I dati fino ad 1999 anno non disponibili. Il numero di osservazioni attuali secondo i date: 14.
La fonte (nome):
Indicatori dello sviluppo mondiale
La fonte (organizzazione):
United Nations Educational, Scientific, and Cultural Organization (UNESCO) Institute for Statistics.
Categorie:
Education
sono stati aggiornati
23 apr 2017 anni
Indicatori delle variazioni dei valori per anni
In media:
90.283
Minima:
79.167
1 gen 2001 anni
Massimo:
100.0
1 gen 2002 anni
Alla data di osservazione
Valore
Variazione assoluta
La variazione rispetto al valore precedente
1 gen 2000 anni
90.909
+90.909
0.0%
1 gen 2001 anni
79.167
-11.742
-12.92%
1 gen 2002 anni
100.0
+20.833
26.32%
1 gen 2003 anni
100.0
0.0
0.0%
1 gen 2004 anni
94.444
-5.556
-5.56%
1 gen 2005 anni
95.833
+1.389
1.47%
1 gen 2007 anni
89.232
-6.601
-6.89%
1 gen 2008 anni
91.114
+1.881
2.11%
1 gen 2009 anni
93.81
+2.697
2.96%
1 gen 2010 anni
96.207
+2.396
2.55%
1 gen 2011 anni
89.77
-6.437
-6.69%
1 gen 2012 anni
82.296
-7.474
-8.33%
1 gen 2013 anni
79.752
-2.544
-3.09%
1 gen 2014 anni
81.434
+1.682
2.11%
Classificazione dei paesi secondo i statistiche attuali per anni