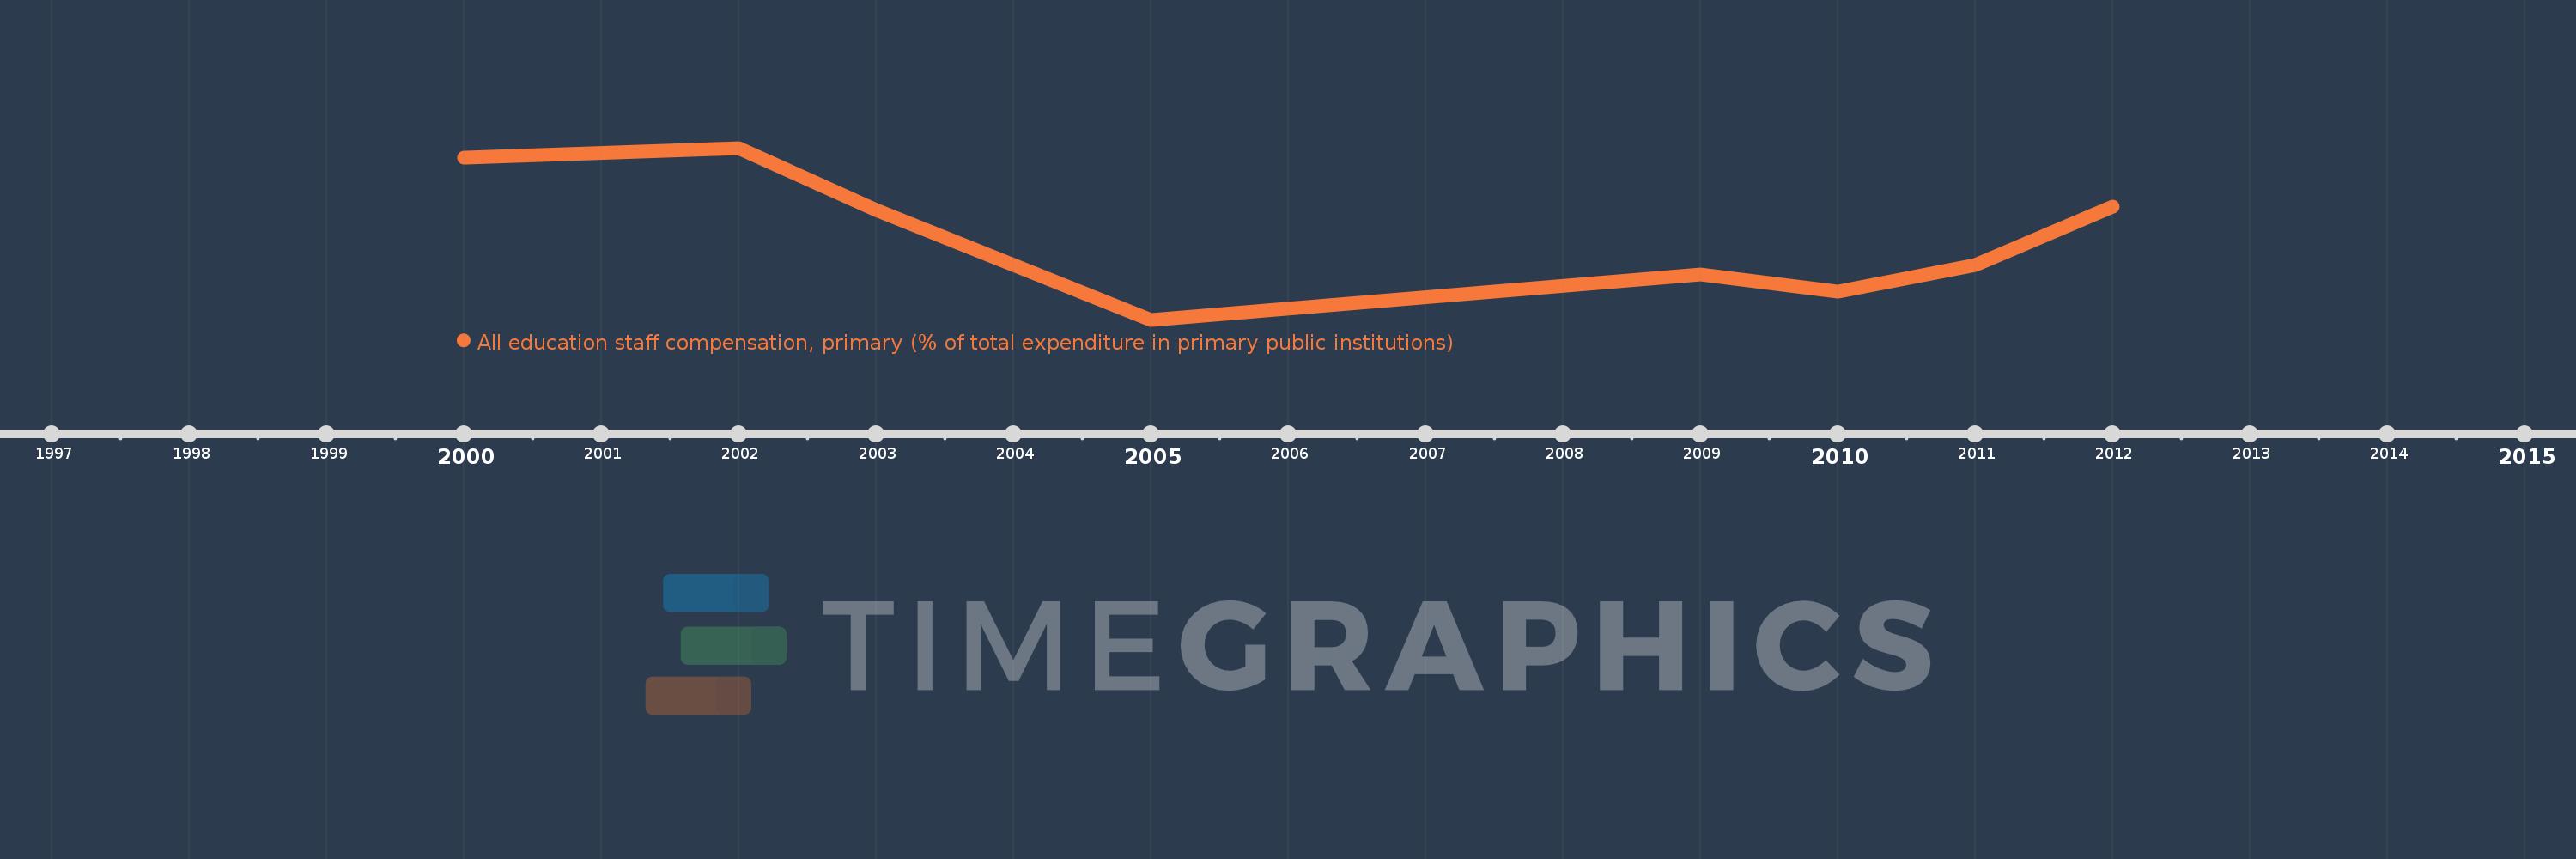
Questa scala temporale mostra un grafico dal 2000 anno al 2012 anno. Burundi. I dati fino ad 1999 anno non disponibili. Il numero di osservazioni attuali secondo i date: 8.
La fonte (nome):
Indicatori dello sviluppo mondiale
La fonte (organizzazione):
United Nations Educational, Scientific, and Cultural Organization (UNESCO) Institute for Statistics.
Categorie:
Education
sono stati aggiornati
23 apr 2017 anni
Indicatori delle variazioni dei valori per anni
In media:
80.752
Minima:
64.18
1 gen 2005 anni
Massimo:
97.396
1 gen 2002 anni
Alla data di osservazione
Valore
Variazione assoluta
La variazione rispetto al valore precedente
1 gen 2000 anni
95.518
+95.518
0.0%
1 gen 2002 anni
97.396
+1.878
1.97%
1 gen 2003 anni
85.419
-11.978
-12.3%
1 gen 2005 anni
64.18
-21.239
-24.86%
1 gen 2009 anni
73.015
+8.836
13.77%
1 gen 2010 anni
69.653
-3.362
-4.61%
1 gen 2011 anni
74.739
+5.086
7.3%
1 gen 2012 anni
86.098
+11.36
15.2%
Classificazione dei paesi secondo i statistiche attuali per anni